Index
- Static and Dynamic Models
- Unified Model Language (UML)
- Structural UML Diagrams
- [[#1. [Class Diagram](https //www.geeksforgeeks.org/unified-modeling-language-uml-class-diagrams/)]]
- Relationships between classes
- [[#2. [Package Diagram](https //www.geeksforgeeks.org/package-diagram-introduction-elements-use-cases-and-benefits/)]]
- Package Relationships
- [[#3. [Object Diagram](https //www.geeksforgeeks.org/unified-modeling-language-uml-object-diagrams/)]]
- Object Diagram Notations
- [[#4. [Component Diagram](https //www.geeksforgeeks.org/component-based-diagram/)]]
- Components of Component-Based Diagram
- 6. Deployment Diagram
- Components and Notations in Deployment Diagram
- 2. Behavioral UML Diagrams
- 1. State Machine Diagram
- Basic components and notations of a State Machine Diagram
- 2. Activity Diagrams
- Activity Diagram Notations
- 3. Use-Case Diagram
- Use-Case diagram Notations
- 4. Sequence Diagram
- 7. Interaction Overview Diagram
Static and Dynamic Models
1. Static Models
Static models capture the structural or static aspects of a system, focusing on the "what" rather than the "how" or "when." They describe the system’s components, their relationships, and organization at a particular moment in time.
Purpose: Static models provide a blueprint of system architecture and data structures, helping to define objects, classes, methods, data types, and relationships without considering runtime behavior.
Diagrams Used:
- Class Diagrams: Show classes and their attributes, operations, and relationships (inheritance, associations).
- Component Diagrams: Describe the organization and dependencies of components.
- Object Diagrams: Capture instances of classes, showing specific objects and their relationships.
Advantages:
-
Useful for planning the system architecture and understanding its components.
-
Helps ensure modularity, clear relationships, and efficient organization of classes or entities. o Easier to maintain and update without altering runtime behavior.
Limitations: Static models don’t provide insights into how the system behaves or evolves over time, limiting their utility in understanding dynamic, runtime scenarios
2. Dynamic Models
Dynamic models focus on system behavior and interaction over time, capturing "how" the system operates as it reacts to inputs and evolves through various states.
Purpose: Dynamic models provide a view of system processes and behavior, illustrating how objects interact, respond to events, or transition between states at runtime.
Diagrams used:
- Sequence Diagrams: Show the sequence of messages and interactions between objects over time.
- State Diagrams: Capture the lifecycle of an object, describing transitions between states based on events.
- Activity Diagrams: Model workflows or business processes, representing activities and decisions.
Advantages:
- Essential for understanding runtime behavior, user interactions, and system responses.
- Helps identify potential issues like bottlenecks, race conditions, and dependencies during operation.
- Useful for simulating and testing system responses to various scenarios.
Limitations:
- Dynamic models are often more complex to create and maintain than static models and may require frequent updates if the system logic or interaction patterns change.
Unified Model Language (UML)
Unified Modeling Language (UML) is a standardized visual modeling language that is a versatile, flexible, and user-friendly method for visualizing a system’s design. Software system artifacts can be specified, visualized, built, and documented with the use of UML.
- We use UML diagrams to show the behavior and structure of a system.
- UML helps software engineers, businessmen, and system architects with modeling, design, and analysis.
Types of UML Diagrams
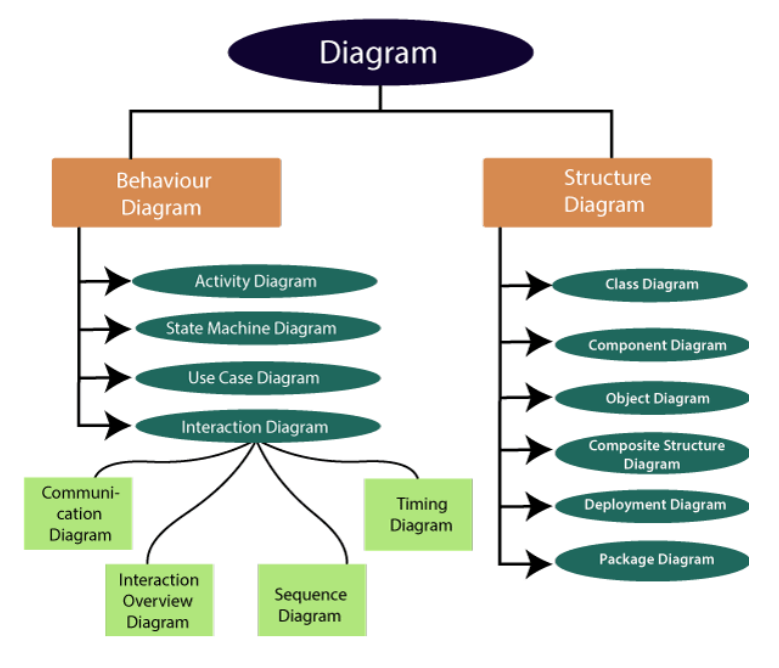
Structural UML Diagrams
https://www.geeksforgeeks.org/structural-diagrams-unified-modeling-languageuml/
Structural UML diagrams are visual representations that depict the static aspects of a system, including its classes, objects, components, and their relationships, providing a clear view of the system’s architecture.
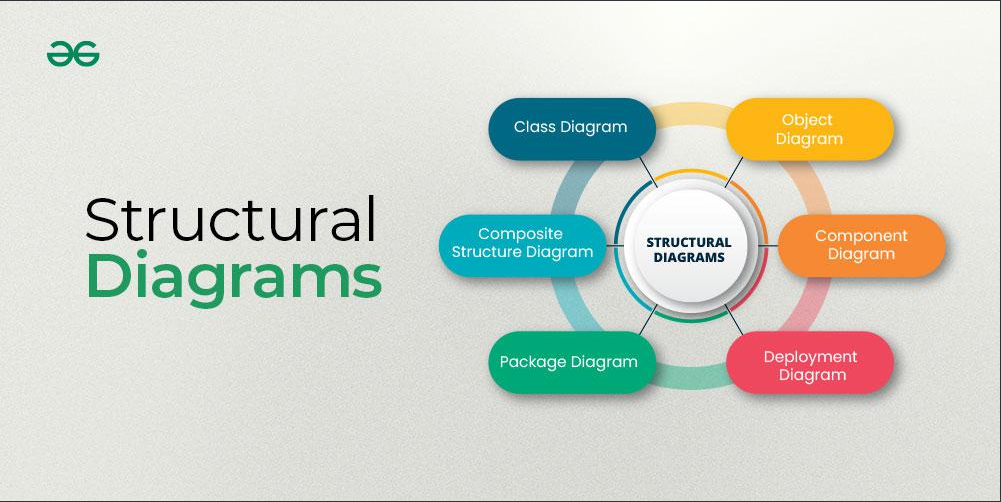
Types of Structural UML diagrams
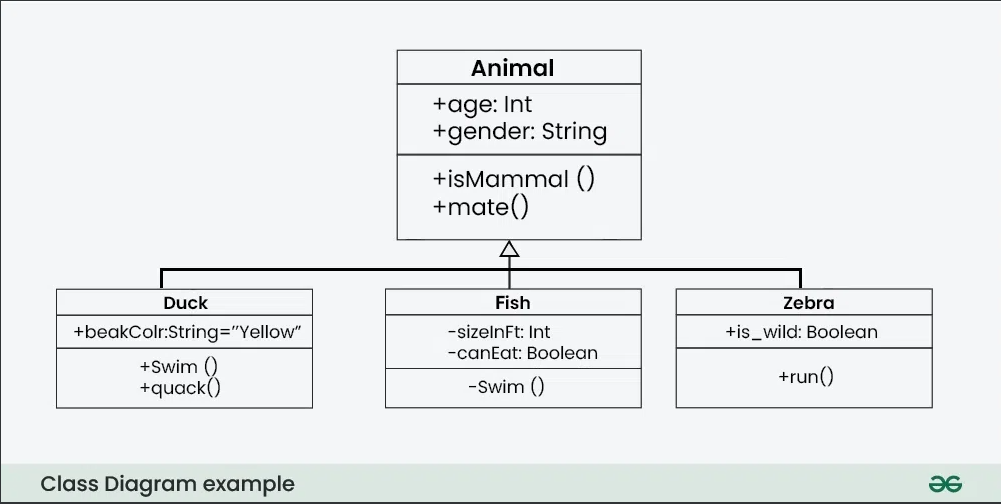
1. Class Diagram
Class diagrams are a type of UML (Unified Modeling Language) diagram used in software engineering to visually represent the structure and relationships of classes within a system i.e. used to construct and visualize object-oriented systems.
- Class diagrams are the main building blocks of every object-oriented method.
- The class diagram can be used to show the classes, relationships, interface, association, and collaboration. UML is standardized in class diagrams.
- Since classes are the building block of an application that is based on OOPs, the class diagram has an appropriate structure to represent the classes, inheritance, relationships, and everything that OOPs have in their context.
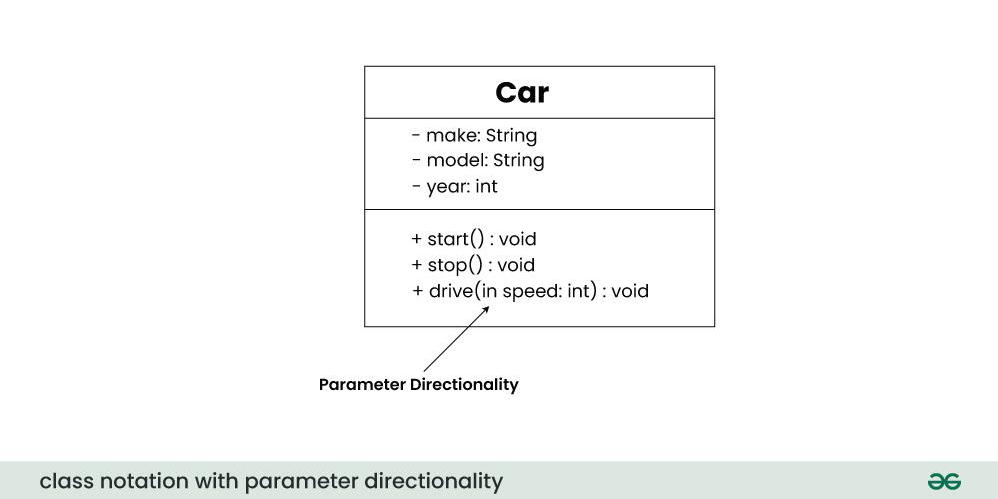
UML Class Notation
Class notation is a graphical representation used to depict classes and their relationships in object-oriented modeling.
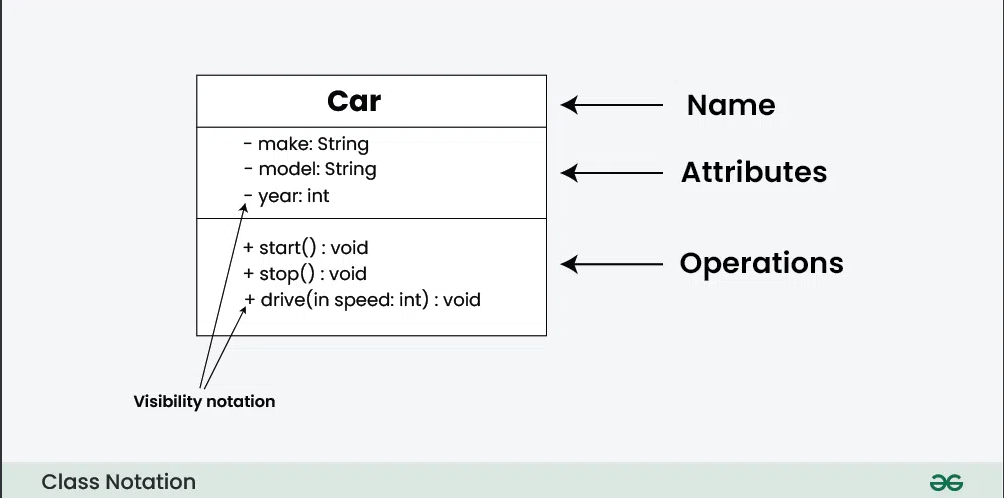
- Class Name:*
- The name of the class is typically written in the top compartment of the class box and is centered and bold.
- Attributes:
- Attributes, also known as properties or fields, represent the data members of the class. They are listed in the second compartment of the class box and often include the visibility (e.g., public, private) and the data type of each attribute.
- Methods:
- Methods, also known as functions or operations, represent the behavior or functionality of the class. They are listed in the third compartment of the class box and include the visibility (e.g., public, private), return type, and parameters of each method.
- Visibility Notation:
- Visibility notations indicate the access level of attributes and methods. Common visibility notations include:
+for public (visible to all classes)-for private (visible only within the class)#for protected (visible to subclasses)~for package or default visibility (visible to classes in the same package)
- Visibility notations indicate the access level of attributes and methods. Common visibility notations include:
Parameter Directionality
In class diagrams, parameter directionality refers to the indication of the flow of information between classes through method parameters. It helps to specify whether a parameter is an input, an output, or both. This information is crucial for understanding how data is passed between objects during method calls.
There are three main parameter directionality notations used in class diagrams:
- In (Input):
- An input parameter is a parameter passed from the calling object (client) to the called object (server) during a method invocation.
- It is represented by an arrow pointing towards the receiving class (the class that owns the method).
- Out (Output):
- An output parameter is a parameter passed from the called object (server) back to the calling object (client) after the method execution.
- It is represented by an arrow pointing away from the receiving class.
- InOut (Input and Output):
- An InOut parameter serves as both input and output. It carries information from the calling object to the called object and vice versa.
- It is represented by an arrow pointing towards and away from the receiving class.
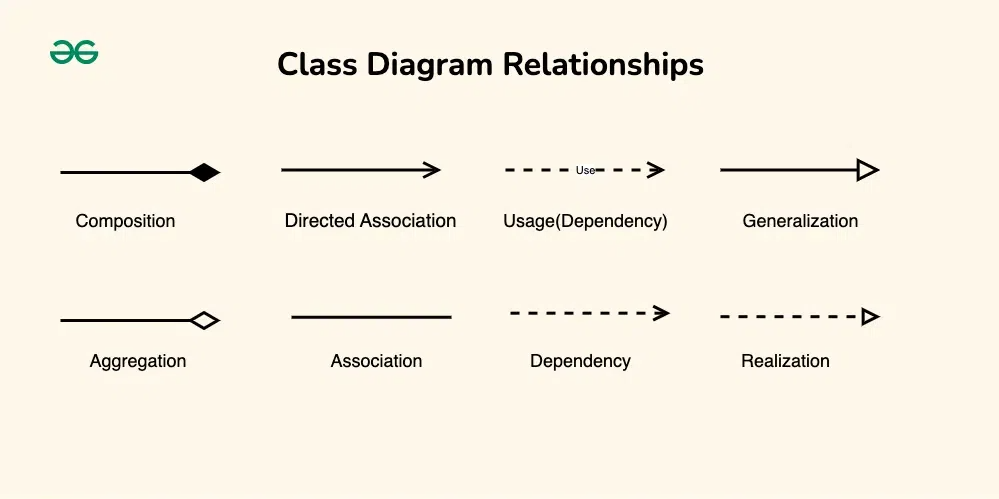
Relationships between classes
In class diagrams, relationships between classes describe how classes are connected or interact with each other within a system. There are several types of relationships in object-oriented modeling, each serving a specific purpose. Here are some common types of relationships in class diagrams:
1. Association
An association represents a bi-directional relationship between two classes. It indicates that instances of one class are connected to instances of another class. Associations are typically depicted as a solid line connecting the classes, with optional arrows indicating the direction of the relationship.
Let’s understand association using an example:
Let’s consider a simple system for managing a library.

In this system, we have two main entities: `Book` and `Library`.

Each `Library` contains multiple `Books`, and each `Book` belongs to a specific `Library`.

This relationship between `Library` and `Book` represents an association.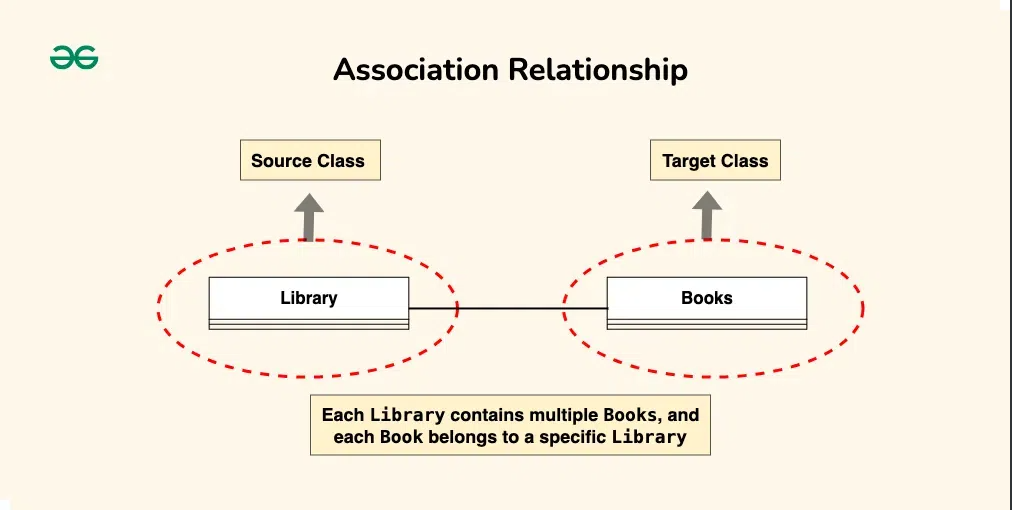
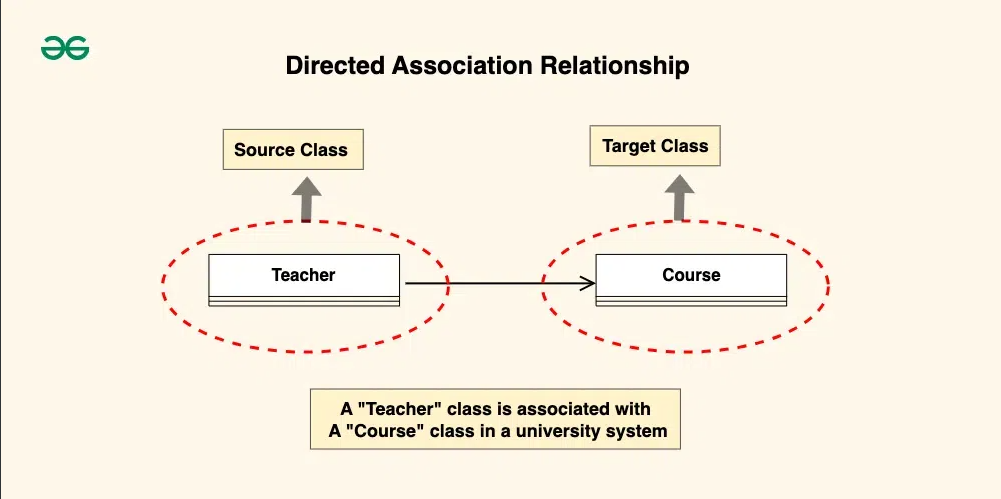
2. Directed Association
A directed association in a UML class diagram represents a relationship between two classes where the association has a direction, indicating that one class is associated with another in a specific way.
- In a directed association, an arrowhead is added to the association line to indicate the direction of the relationship. The arrow points from the class that initiates the association to the class that is being targeted or affected by the association.
- Directed associations are used when the association has a specific flow or directionality, such as indicating which class is responsible for initiating the association or which class has a dependency on another.
Consider a scenario where a “Teacher” class is associated with a “Course” class in a university system.

The directed association arrow may point from the “Teacher” class to the “Course” class, indicating that a teacher is associated with or teaches a specific course.
- The source class is the “Teacher” class. The “Teacher” class initiates the association by teaching a specific course.
- The target class is the “Course” class. The “Course” class is affected by the association as it is being taught by a specific teacher.
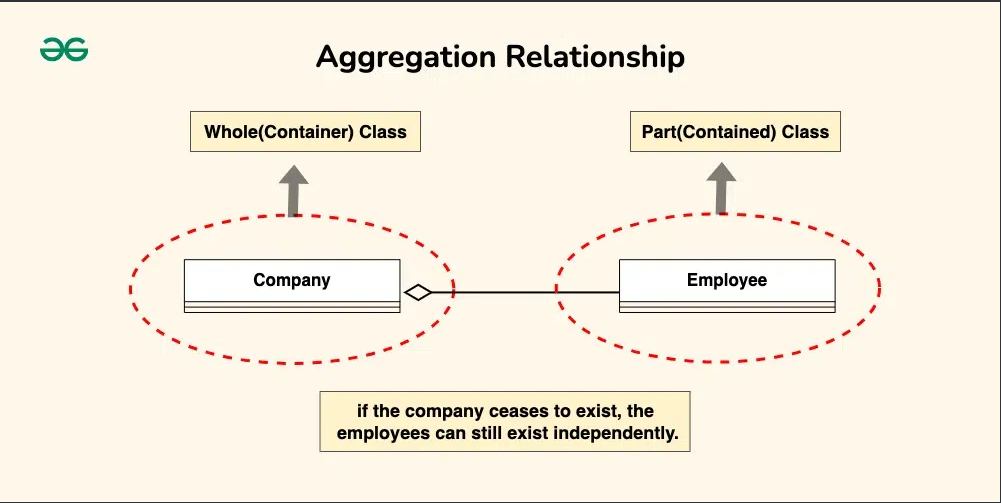
3. Aggregation
Aggregation is a specialized form of association that represents a “whole-part” relationship. It denotes a stronger relationship where one class (the whole) contains or is composed of another class (the part). Aggregation is represented by a diamond shape on the side of the whole class. In this kind of relationship, the child class can exist independently of its parent class.
Let’s understand aggregation using an example:
The company can be considered as the whole, while the employees are the parts. Employees belong to the company, and the company can have multiple employees. However, if the company ceases to exist, the employees can still exist independently.
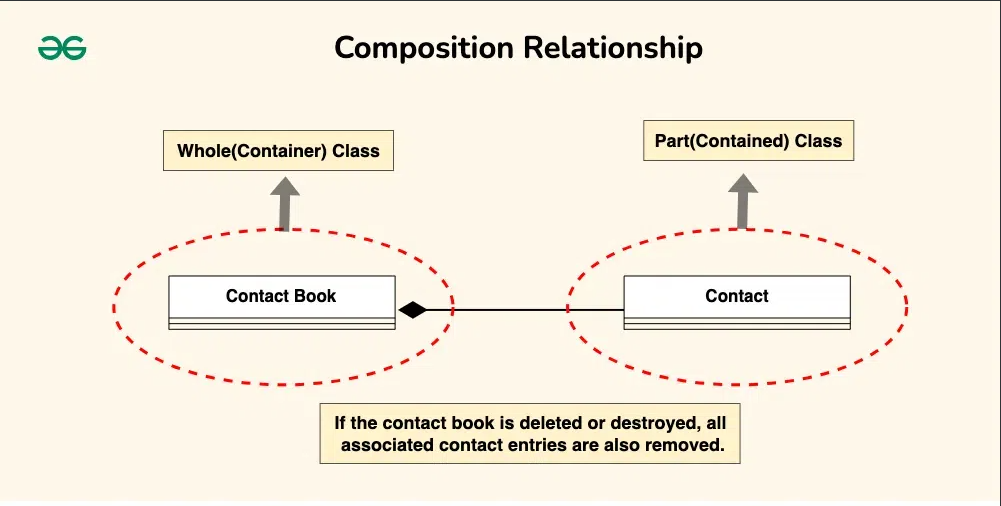
4. Composition
Composition is a stronger form of aggregation, indicating a more significant ownership or dependency relationship. In composition, the part class cannot exist independently of the whole class. Composition is represented by a filled diamond shape on the side of the whole class.
Let’s understand Composition using an example:
Imagine a digital contact book application.
The contact book is the whole, and each contact entry is a part.
Each contact entry is fully owned and managed by the contact book.
If the contact book is deleted or destroyed, all associated contact entries are also removed.
2. Package Diagram
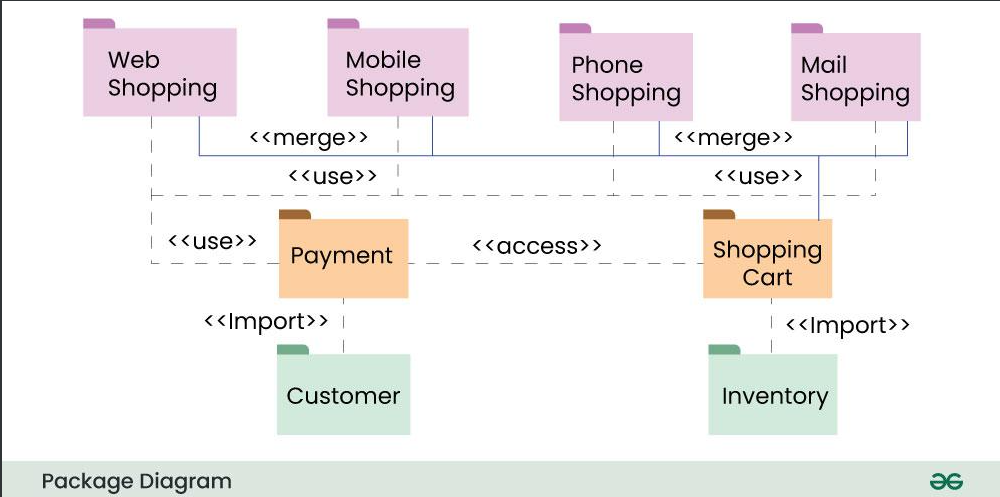
- A package diagram is a type of Unified Modeling Language (UML) diagram mainly used to represent the organization and the structure of a system in the form of packages.
- A package is used as a container to organize the elements present in the system into a more manageable unit.
- It is very useful to represent the system’s architecture and design as a cohesive unit and concise manner.
Basic Elements of Package Diagrams
The following are the basic elements of a Package Diagrams:
In a package diagram, several key elements help organize and clarify the relationships within a system:
-
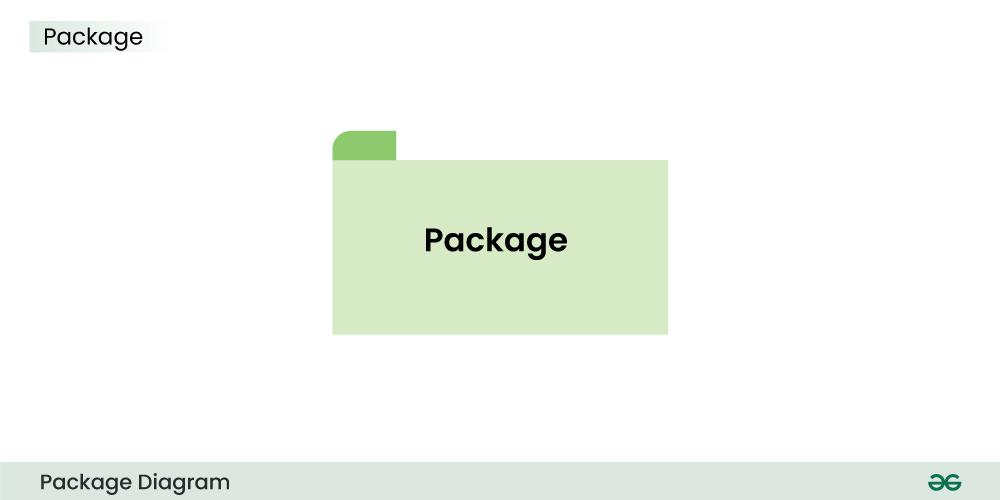
Package: This is the fundamental unit of a package diagram, serving as a container for various elements like classes and interfaces. It’s depicted as a folder-like icon with a name label, making it easy to identify.
-
*NameSpace: This denotes the name of the package and usually appears at the top of the package symbol. It helps uniquely identify the package within the diagram.
-
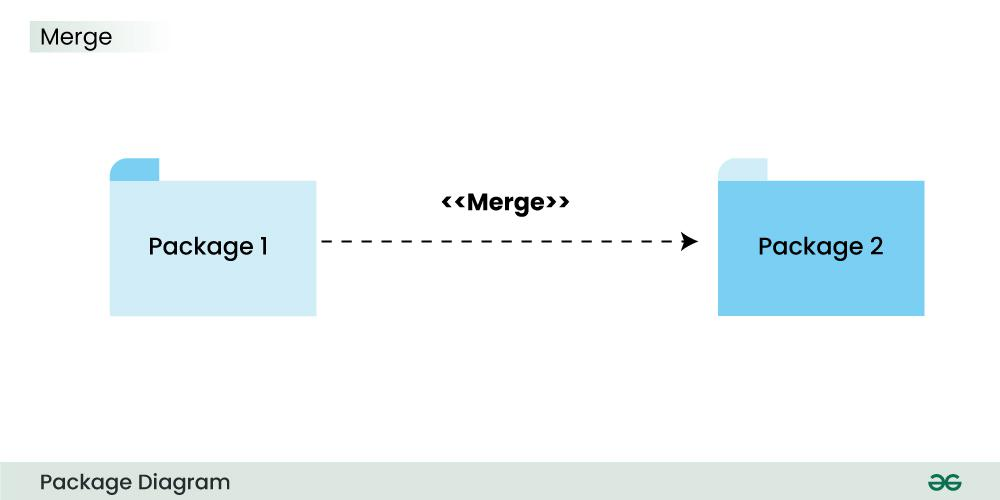
*Package Merge: This relationship illustrates how one package can be merged with another. It’s represented by a direct arrow between the two packages, indicating that their contents can combine.
-
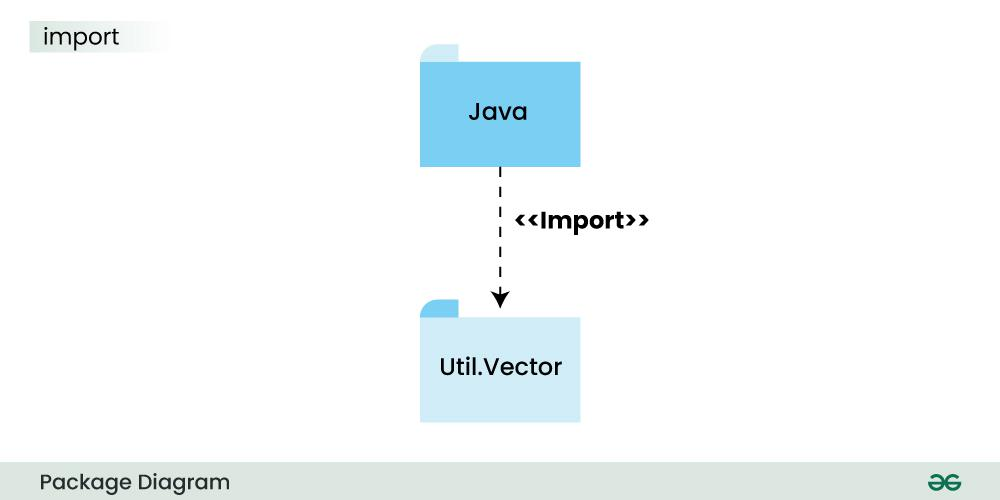
*Package Import: This relationship shows that one package can access the contents of another package, depicted with a dashed arrow.
-
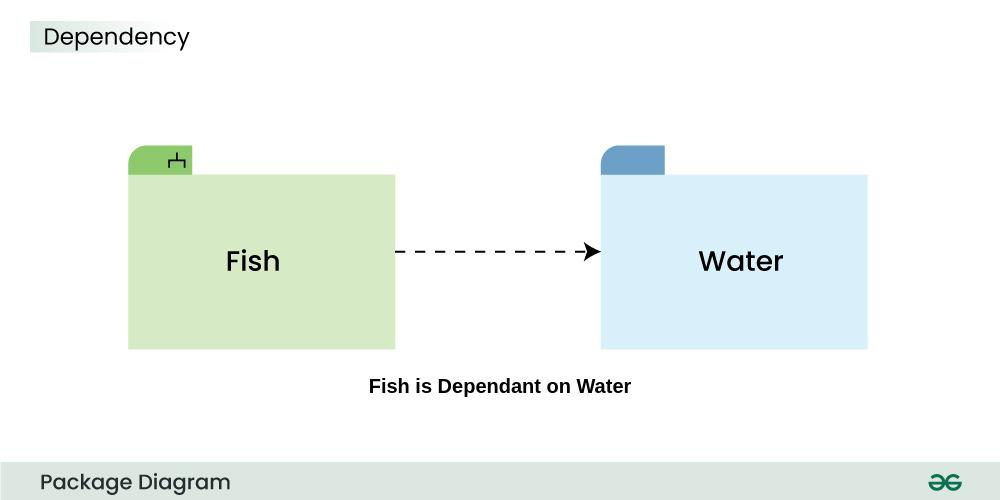
*Dependency: Dependencies indicate that changes in one package may affect another. This relationship signifies that one element or package relies on another, highlighting how interconnected they are.
-
*Element: An element is a single unit within a package, which can be a class, interface, or subsystem. Elements reside inside packages and are connected to the main package. For instance, a class may contain various functions and variables, all of which are considered elements tied to that class.
-
*Constraint: This represents a condition or requirement associated with a package, typically shown in curly braces. Constraints help define the rules or limitations for how the package operates.
Package Structure and Notation
Below are the package structures and their notations:
- Package :
- Subsystem:
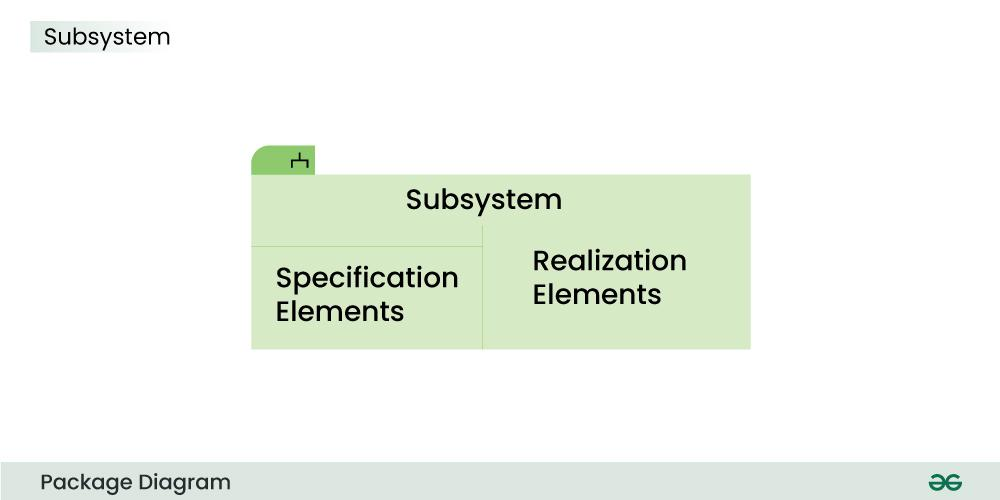
- Dependency:
- Import:
- Merge:
Package Relationships
1. Package Merge Relationship
This relationship is used to represent that the contents of a package can be merged with the contents of another package. This implies that the source and the target package has some elements common in them, so that they can be merged together.
Example:
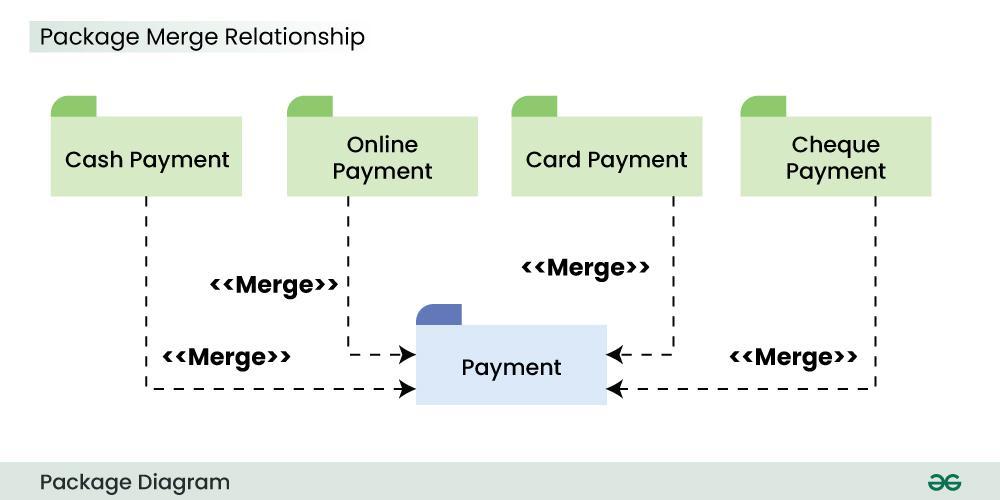
The above diagram depicts that the packages are of different type of payments, but all of them are a some kind of payment mechanism, so they can all be merged to be called as payment.
2. Package Dependency Relationship
A package can be dependent on other different packages, signifying that the source package is somehow dependent on the target package.
Example:
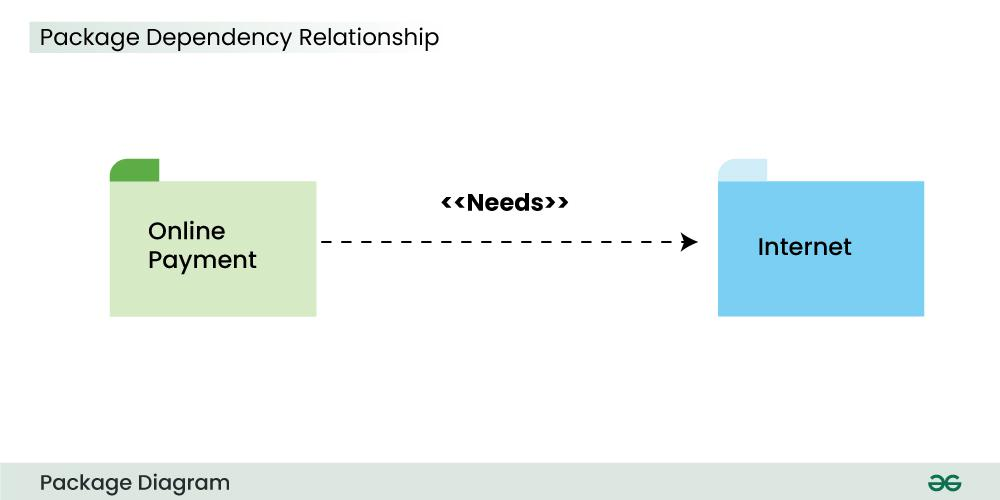
The above diagram depicts that the online payment package is dependent on the Internet package and uses “need” dependency.
3. Package Import Relationship
This relationship is used to represent that a package is importing another package to use. It signifies that the importing package can access the public contents of the imported package.
Example:
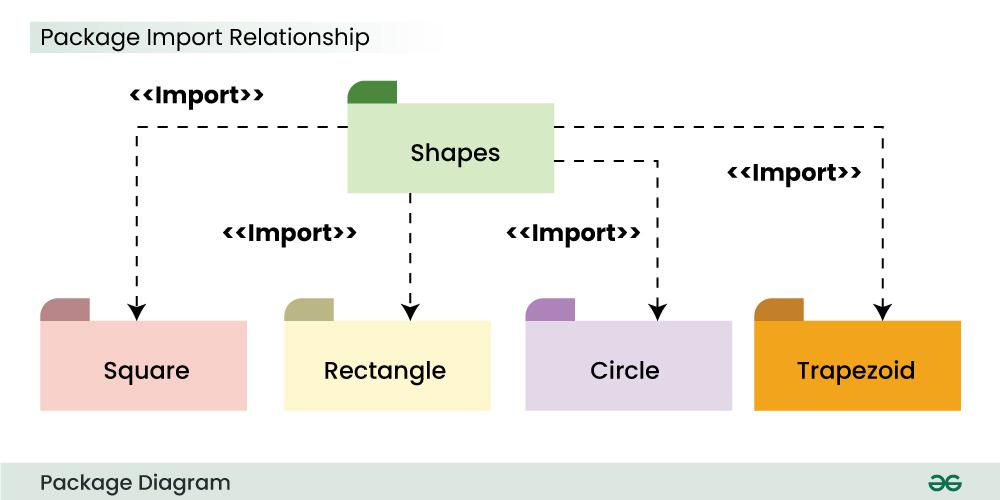
The above package diagram shows the import relationship between the main package Shapes and it’s various other sub packages Square, Rectangle etc. They all are importing the real Shapes package so that the public contents of the Shapes package can be used by them.
4. Package Access Relationship
This type of relationship signifies that there is a access relationship between two or more packages, meaning that one package can access the contents of another package without importing it.
Example:
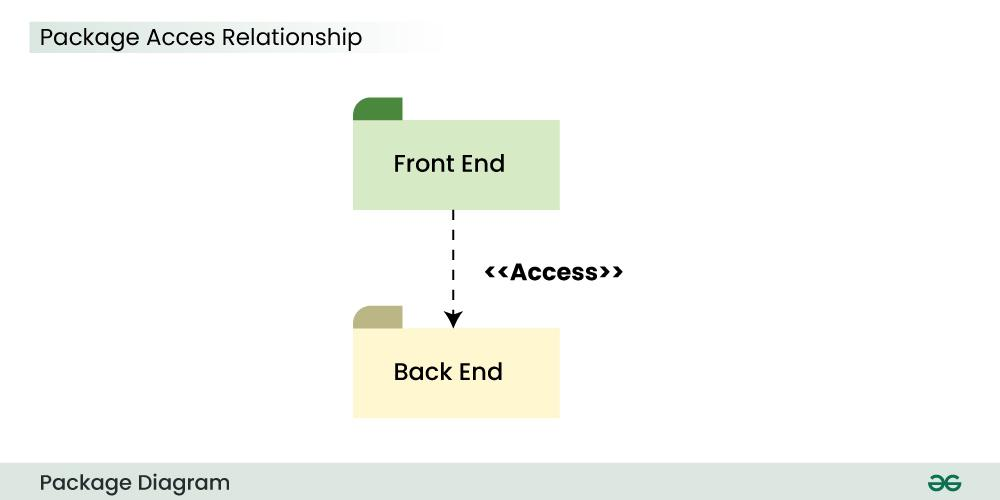
The above diagram depicts the Access relationship between the Front End and Back End services. It is much needed that a front end service can easily access the important Back End services to carry out any operation.
Use Cases of Package Diagrams
A package diagram is a vital tool in system design, helping to model and illustrate the structure of an organization or system. Here are some key use cases:
-
It visually represents the system’s structure, organizing elements into smaller, manageable packages. This makes it easier to understand the overall layout.
-
The diagram helps manage and organize related modules or components within a system, grouping them for clarity.
-
Developers use package diagrams to show dependencies between different packages, which helps clarify the system’s architecture and the potential impact of changes.
-
System architects can break down complex problems into smaller, manageable parts early in the design process, simplifying component design and implementation.
Benefits of Package Diagram
Below are the benefits of package diagram:
- It provides a visual representation of the system’s architecture, showing that how each elements are organized and interact with each other.
- Package Diagram encourages a modular approach to represent any system in form of smaller and easy to understand packages. It also supports the encapsulation of elements into packages which share a same trait.
- It servers as a common language of communication between the developers and the stakeholders.
- By showing the dependency between the different packages, it become easy to identify and manage dependencies between the packages, also it becomes easy to address issues related to coupling and cohesion.
Challenges of Package Diagrams
Below are the challenges of Package diagrams:
- Balancing detail and simplicity in a package diagram is challenging.
- Each package should avoid being overloaded with information to maintain clarity.
- The focus is primarily on the static structure of system elements.
- Package diagrams may not effectively capture dynamic aspects, like runtime behaviors or interactions.
- Dependencies among packages are essential to show, but overemphasis can create clutter.
- Dependencies should be presented clearly and concisely for better understanding.
3. Object Diagram
- An Object Diagram can be referred to as a screenshot of the instances in a system and the relationship that exists between them.
- Since object diagrams depict behaviour when objects have been instantiated, we are able to study the behavior of the system at a particular instant.
- Object diagrams are vital to portray and understand functional requirements of a system. In other words, “An object diagram in the Unified Modeling Language (UML), is a diagram that shows a complete or partial view of the structure of a modelled system at a specific time.
What is an Object?
An object refers to a specific instance of a class within a system. A class is a blueprint or template that defines the common attributes and behaviors shared by a group of objects. An object, on the other hand, is a concrete and individual occurrence of that class, possessing unique values for its attributes.
What is a Classifier?
In UML a classifier refers to a group of elements that have some common features like methods, attributes and operations. A classifier can be thought of as an abstract metaclass which draws a boundary for a group of instances having common static and dynamic features.
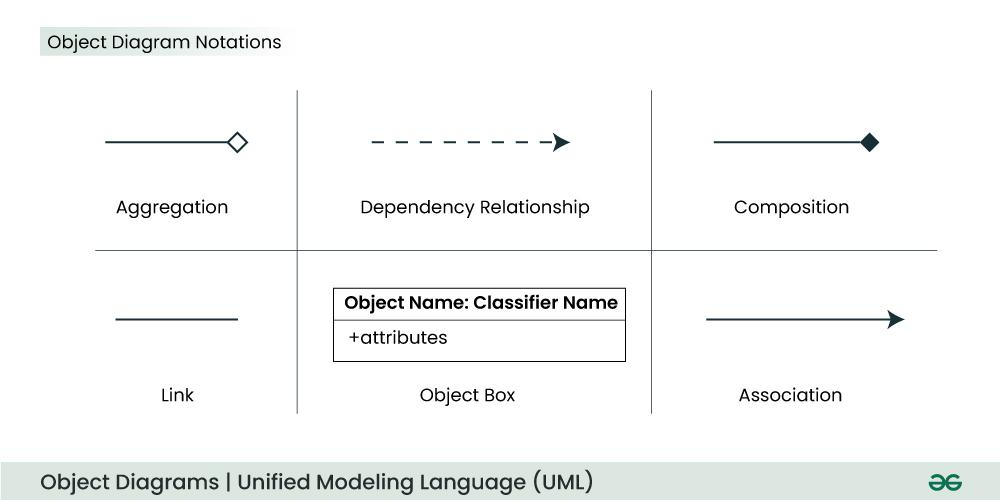
Object Diagram Notations
The object diagram in UML uses specific notations to represent instances of classes and their relationships at a particular moment in time.
1. Objects or Instance specifications
When we instantiate a classifier in a system, the object we create represents an entity which exists in the system. We can represent the changes in object over time by creating multiple instance specifications. We use a rectangle to represent an object in an object diagram.
2. Attributes and Values
Inside the object box, attributes of the object are listed along with their specific values.
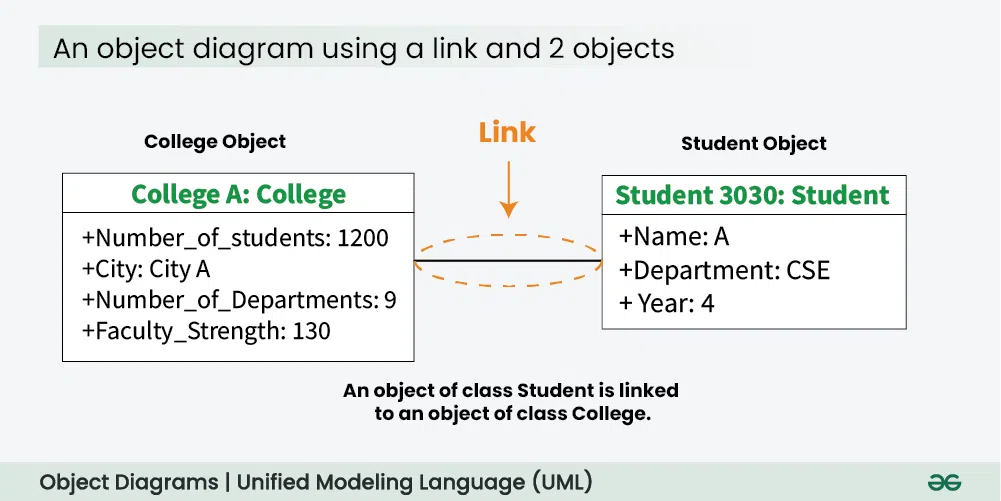
3. Link
We use a link to represent a relationship between two objects. We represent the number of participants on the link for each, at the end of the link. The term link is used to specify a relationship between two instance specifications or objects. We use a solid line to represent a link between two objects.
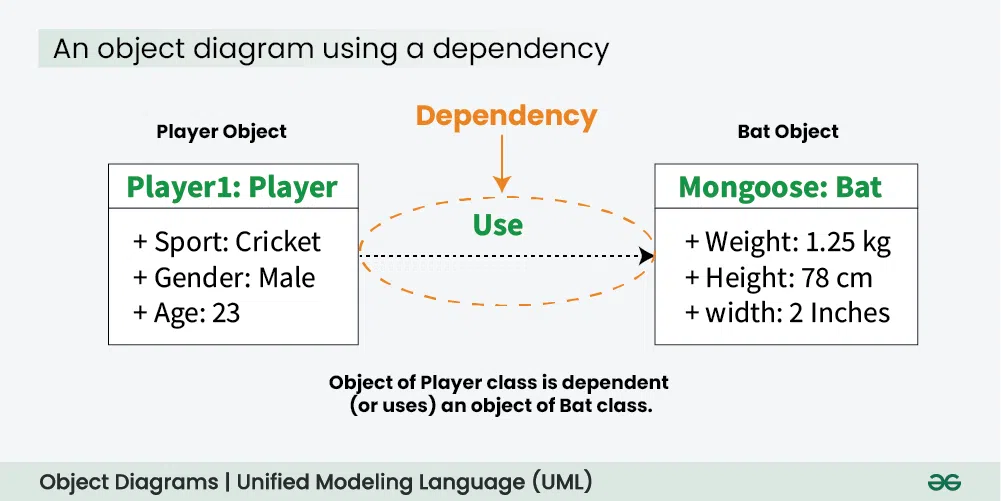
4. Dependency relationships
We use a dependency relationship to show when one element depends on another element. A dependency is used to depict the relationship between dependent and independent entities in the system.
- Any change in the definition or structure of one element may cause changes to the other.
- This is a unidirectional kind of relationship between two objects.
- Dependency relationships are of various types specified with keywords like Abstraction, Binding, Realization, Substitution and Usage are the types of dependency relationships used in UML.
Example: In the figure below, an object of Player class is dependent (or uses) an object of Bat class.
4. Component Diagram
- Component diagrams are used to represent how the physical components in a system have been organized. We use them for modelling implementation details.
- Component Diagrams depict the structural relationship between software system elements and help us in understanding if functional requirements have been covered by planned development.
- Component Diagrams become essential to use when we design and build complex systems.
- Interfaces are used by components of the system to communicate with each other.
What is a Component Diagram?
One kind of structural diagram in the Unified Modeling Language (UML) that shows how the components of a system are arranged and relate to one another is termed a component-based diagram, or simply a component diagram.
- System components are modular units that offer a set of interfaces and encapsulate implementation.
- These diagrams illustrate how components are wired together to form larger systems, detailing their dependencies and interactions.
Component-Based Diagrams are widely used in system design to promote modularity, enhance understanding of system architecture
Components of Component-Based Diagram
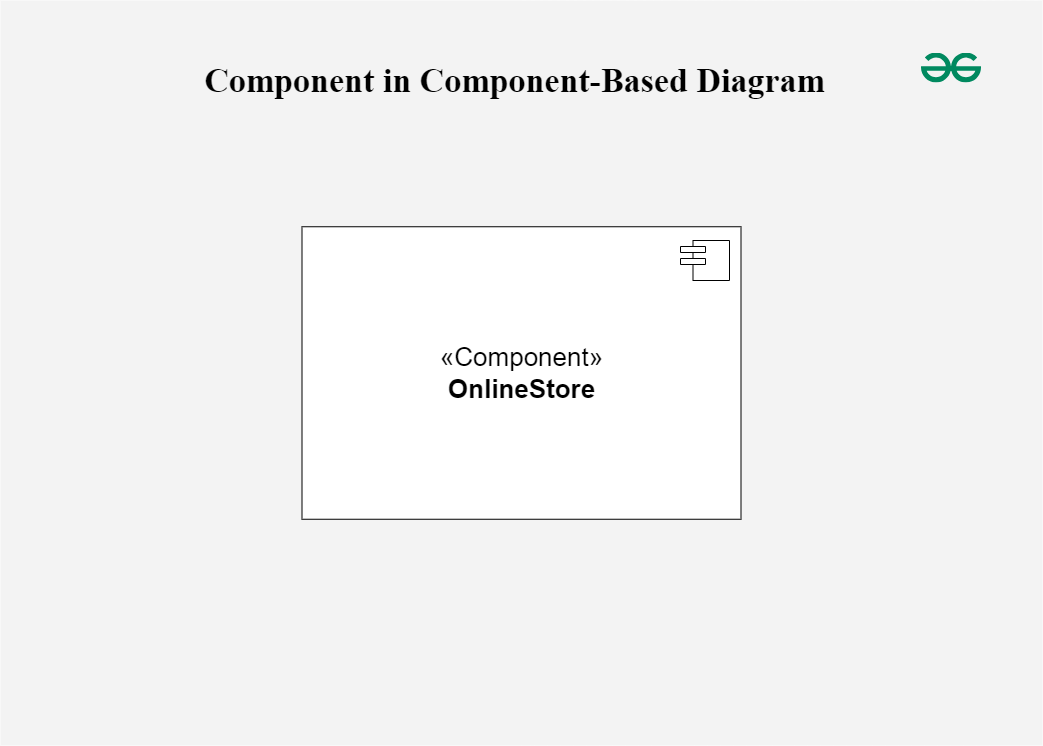
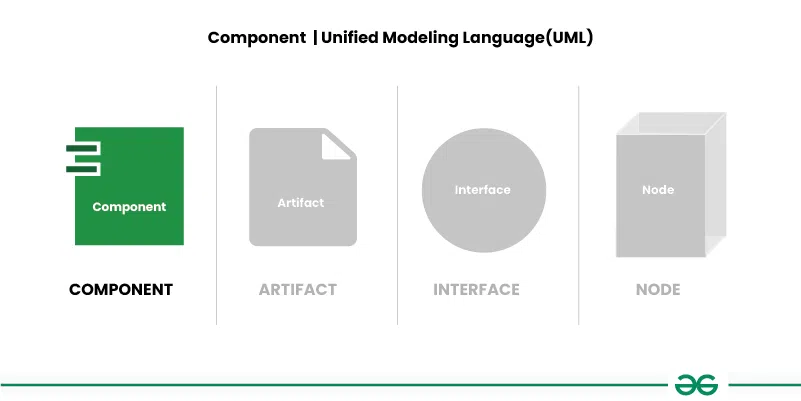
1. Component
Represent modular parts of the system that encapsulate functionalities. Components can be software classes, collections of classes, or subsystems.
- Symbol: Rectangles with the component stereotype («component»).
- Function: Define and encapsulate functionality, ensuring modularity and reusability.
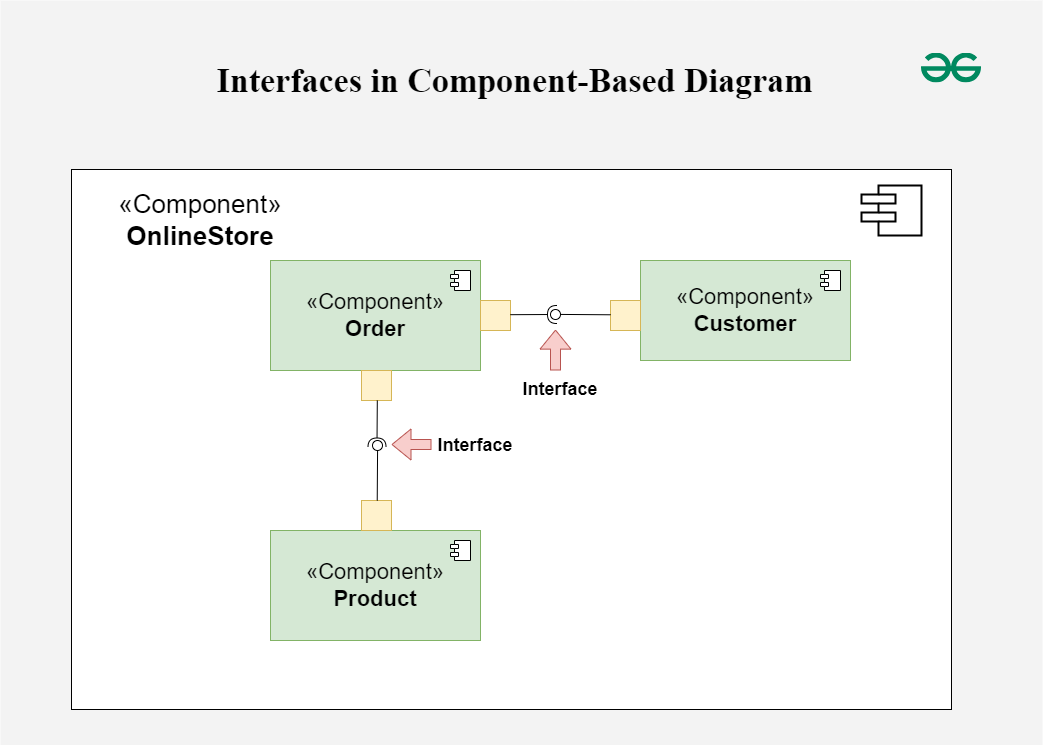
2. Interfaces
Specify a set of operations that a component offers or requires, serving as a contract between the component and its environment.
- Symbol: Circles (lollipops) for provided interfaces and half-circles (sockets) for required interfaces.
- Function: Define how components communicate with each other, ensuring that components can be developed and maintained independently.
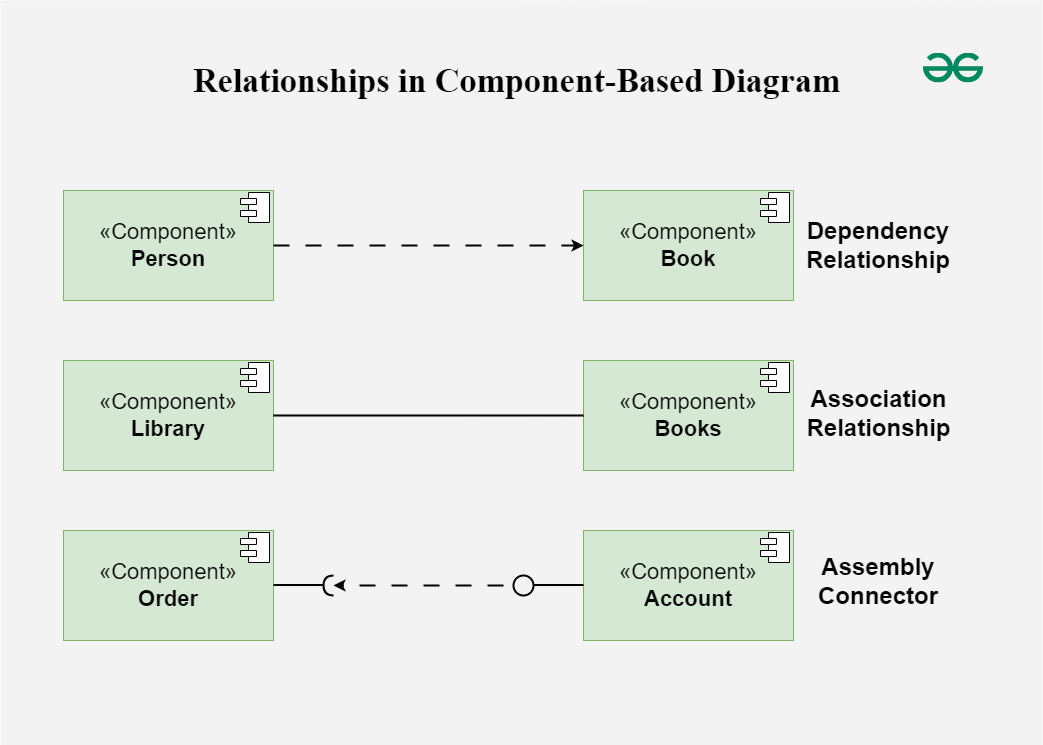
3. Relationships
Depict the connections and dependencies between components and interfaces.
-
Symbol: Lines and arrows.
- Dependency (dashed arrow): Indicates that one component relies on another.
- Association (solid line): Shows a more permanent relationship between components.
- Assembly connector: Connects a required interface of one component to a provided interface of another.
-
Function: Visualize how components interact and depend on each other, highlighting communication paths and potential points of failure.
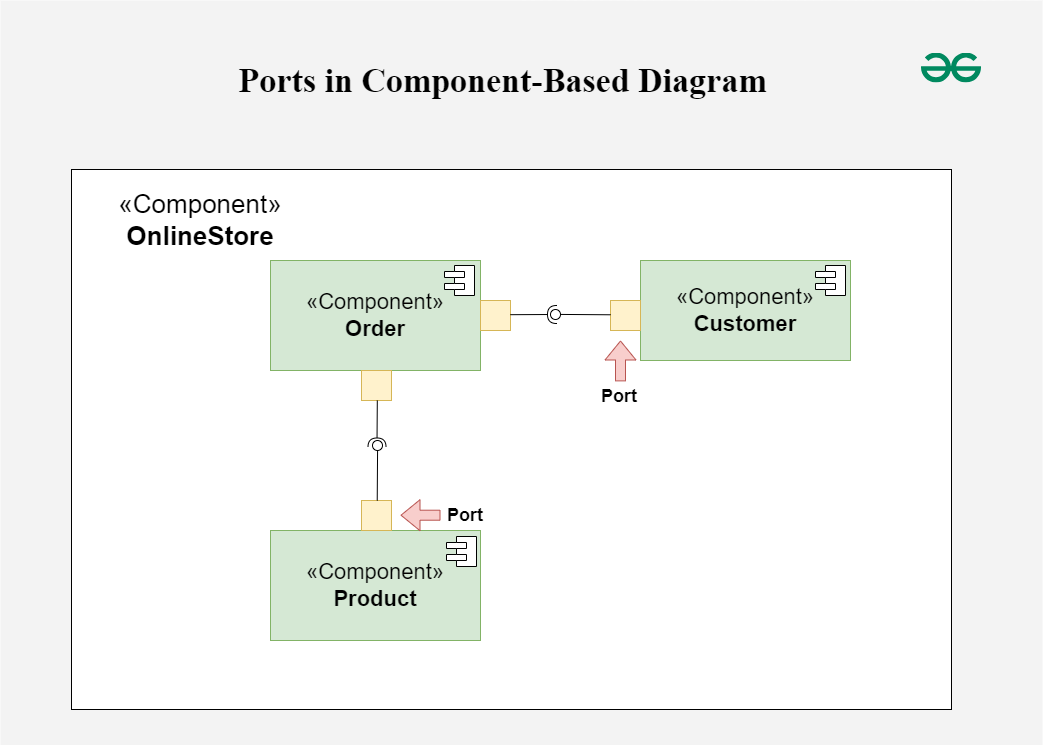
4. Ports
Role: Represent specific interaction points on the boundary of a component where interfaces are provided or required.
- Symbol: Small squares on the component boundary.
- Function: Allow for more precise specification of interaction points, facilitating detailed design and implementation.
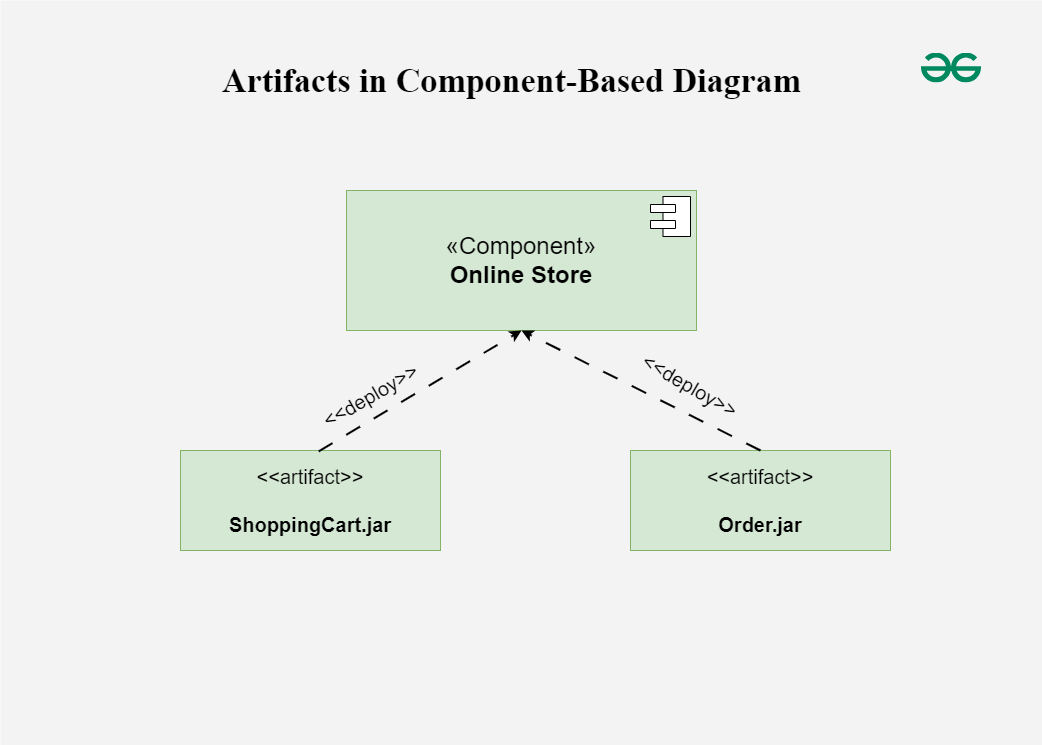
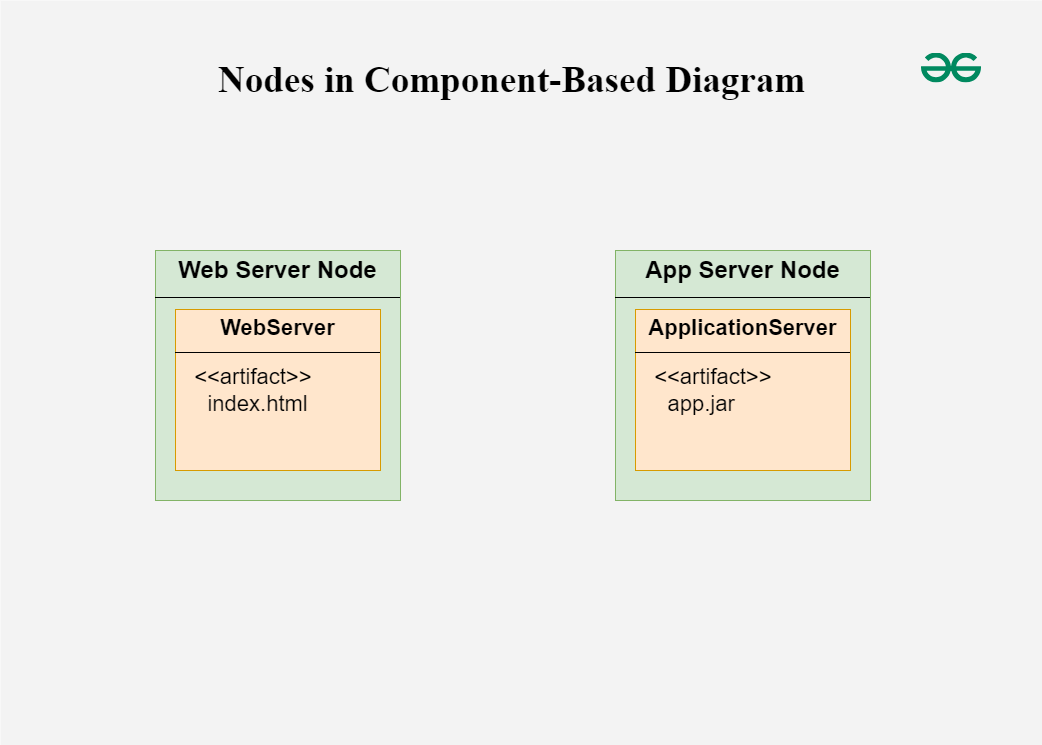
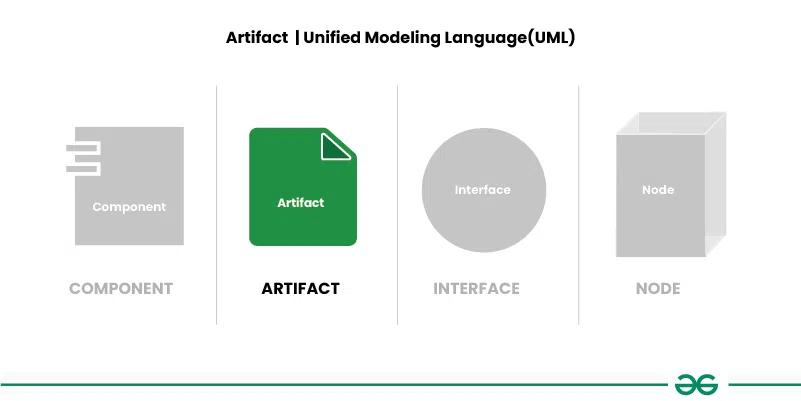
5. Artifacts
Represent physical files or data that are deployed on nodes.
- Symbol: Rectangles with the artifact stereotype («artifact»).
- Function: Show how software artifacts, like executables or data files, relate to the components.
6. Nodes
Represent physical or virtual execution environments where components are deployed.
- Symbol: 3D boxes.
- Function: Provide context for deployment, showing where components reside and execute within the system’s infrastructure.
Example of a Component-Based Diagram
This component diagram represents an Online Store system, breaking it down into various functional components and showing how they interact. Here’s a breakdown of each part:
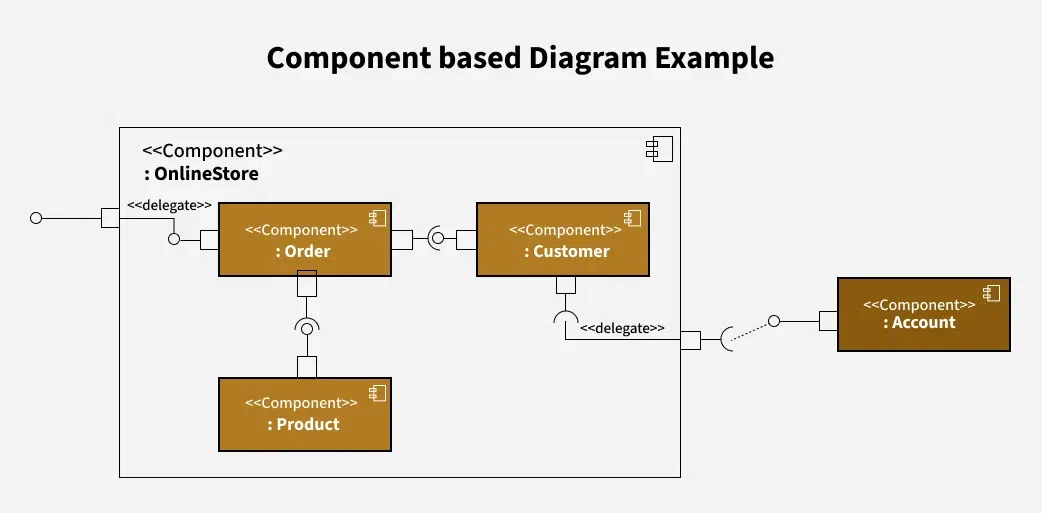
-
OnlineStore Component: This is the main component encapsulating the entire system. It includes three internal components: Order, Customer, and Product.
-
Order Component: This component handles order-related operations within the Online Store. It is connected to:
- The Product component (which likely manages details of products in each order).
- The Customer component (for associating orders with customers).
- External access points via delegates (marked by
<<delegate>>notation), which indicate that certain internal actions can be routed or passed on to other parts.
-
Customer Component: This component manages customer-related data and activities.
- It’s connected to the Order component to handle customer orders.
- The Account component (outside of OnlineStore) is connected to Customer through a delegate, suggesting that customer-related actions in OnlineStore might involve account information from another system.
-
Product Component: This component manages product-related functions within the Online Store.
- It’s linked to the Order component, allowing orders to reference available products.
-
Account Component: This component is located outside the OnlineStore boundary, indicating it may be a separate system or module. It connects to Customer through a dotted line with a delegate, showing that OnlineStore can delegate certain account-related functions to this external Account component.
5. Composite structure diagram
- A composite structure diagram represents relationship between parts and their configuration which determine how the classifier (class, a component, or a deployment node) behaves.
- They represent internal structure of a structured classifier making the use of parts, ports, and connectors.
- They are similar to class diagrams except they represent individual parts in detail as compared to the entire class.
6. Deployment Diagram
A Deployment Diagram shows how the software design turns into the actual physical system where the software will run. They show where software components are placed on hardware devices and shows how they connect with each other. This diagram helps visualize how the software will operate across different devices
Key elements of a Deployment Diagram
-
Nodes: These represent the physical hardware entities where software components are deployed, such as servers, workstations, routers, etc.
-
Components: Represent software modules or artifacts that are deployed onto nodes, including executable files, libraries, databases, and configuration files.
-
Artifacts: Physical files that are placed on nodes represent the actual implementation of software components. These can include executable files, scripts, databases, and more.
-
Dependencies: These show the relationships or connections between nodes and components, highlighting communication paths, deployment constraints, and other dependencies.
-
Associations: Show relationships between nodes and components, signifying that a component is deployed on a particular node, thus mapping software components to physical nodes.
-
Deployment Specification: This outlines the setup and characteristics of nodes and components, including hardware specifications, software settings, and communication protocols.
-
Communication Paths: Represent channels or connections facilitating communication between nodes and components and includes network connections, communication protocols, etc.
Components and Notations in Deployment Diagram
Below are the components and their notations in deployment diagram:
1. Component
A component represents a modular and reusable part of a system, typically implemented as a software module, class, or package. It encapsulates its behavior and data and can be deployed independently.
2. Artifact
An artifact represents a physical piece of information or data that is used or produced in the software development process. It can include source code files, executables, documents, libraries, configuration files, or any other item.
3. Interface
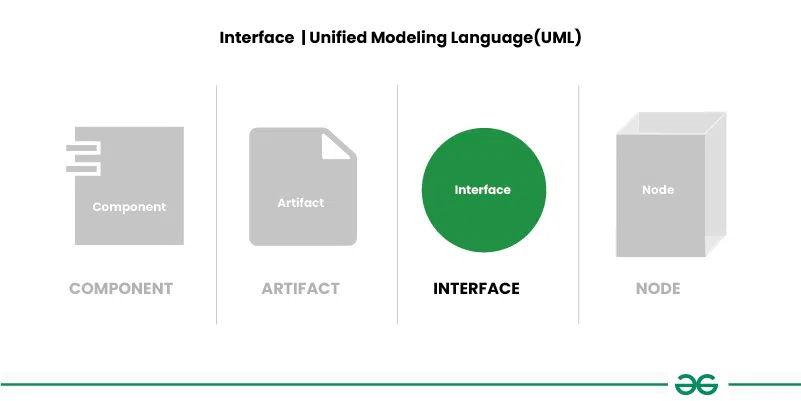
An interface defines a contract specifying the methods or operations that a component must implement. It represents a point of interaction between different components or subsystems.
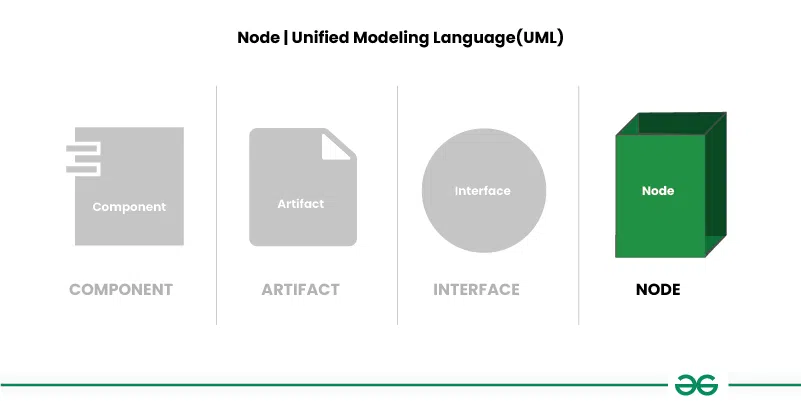
4. Node
A node represents a physical or computational resource, such as a hardware device, server, workstation, or computing resource, on which software components can be deployed or executed.
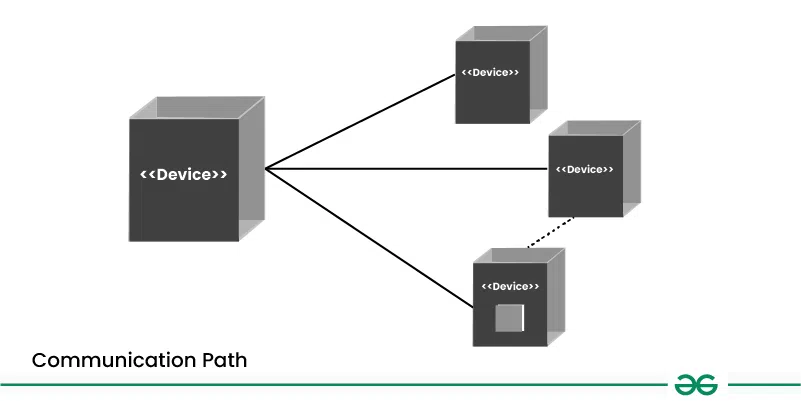
5. Communication path
A straight line that represents communication between two device nodes. Dashed lines in deployment diagrams represents relationships or dependencies between elements, indicating that one element is related to or dependent on another.
Use Cases of Deployment Diagrams
Below are the use cases of deployment diagrams:
- Deployment diagrams help plan how software systems will be set up on different devices.
- They help design the hardware needed to support the software. By showing which software parts go where, they help decide what devices and networks are needed.
- Deployment diagrams make sure each part of the software has enough resources, like memory or processing power, to run well.
- They show how different parts of the software depend on each other and on the hardware.
- By seeing how everything is set up, teams can find ways to make the software run faster and smoother.
Real World Examples of Deployment Diagrams
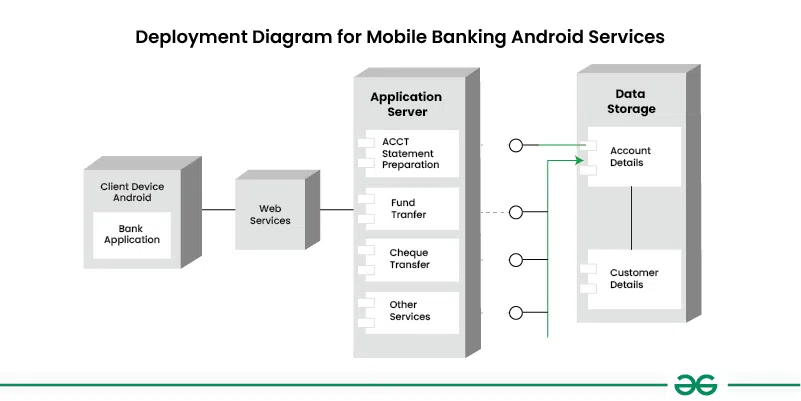
Deployment Diagram for mobile banking android services
In this example, one node represents the client’s Android device. The components represent the software installed on these devices, with the banking application being the specific component on the Android device.
- The diagram also shows how the user connects to the banking server through the web.
- This means the user opens the banking app on their Android device, which then talks to the application server online to carry out tasks like checking account balances or transferring money.
Note: Both Component and Deployment diagrams fall under the category of Implementation Diagram in Structural Diagram
Benefits of using Structural UML diagrams
Structural diagrams are like visual guides that help everyone on a software team see how the different parts of a program fit together. They make planning, building, and fixing things much easier.
- Clear Picture for Everyone:
- Structural UML diagrams are like visual maps that show how different parts of a computer program or system are connected.
- It’s a clear picture that helps everyone understand how things fit together.
- Helps Design and Plan:
- These diagrams are like blueprints for building a house.
- They help the people designing the software see how different pieces will work together.
- Easy to Explain and Share:
- Structural diagrams make it easy to explain how a computer program works and share ideas with the team.
- Keeps Things Organized:
- These diagrams help organize the different parts of a computer program.
- It keeps everything in order, making it easier to understand and update.
- Saves Time and Fixes Problems Early:
- Before building something big, like a bridge, engineers use drawings to catch any problems early. Structural diagrams do the same for computer programs.
- They help find and fix issues before spending lots of time writing the actual code.
Challenges faced in developing Structural UML diagrams
- Abstraction Complexity:
- Abstracting complex systems into simplified diagrams can be challenging.
- Representing complicated relationships and dependencies between classes or components may lead to reduced clarity.
- Maintaining Consistency with Code:
- Ensuring that UML diagrams remain consistent with the actual codebase over time can be challenging.
- Code changes may not always be reflected in the diagrams, leading to discrepancies.
- Choosing the Right Level of Detail:
- Striking the right balance between providing sufficient detail and avoiding overwhelming complexity is a common challenge.
- Including too much detail can hinder readability, while too little may lead to ambiguity.
- Expressing Dynamic Aspects in a Static Diagram:
- Structural diagrams are inherently static, making it challenging to represent dynamic aspects such as behavior or state transitions.
- Capturing dynamic behavior may require additional diagrams like behavior diagrams.
- Handling Change Management:
- Structural diagrams may need frequent updates to reflect changes in the system. Managing and communicating these changes effectively can be challenging, especially in large projects.
- Balancing Simplicity and Completeness:
- Striking a balance between simplicity and completeness is crucial.
- Over-simplified diagrams may lack necessary details, while overly detailed diagrams may become overwhelming.
- Ensuring Consistent Notation:
- Inconsistent use of notation and symbols across diagrams can lead to confusion. Different team members may interpret symbols differently, affecting the overall understanding.
- Tooling and Accessibility:
- Different team members might be familiar with different tools, and not all team members may have easy access to specialized UML tools.
2. Behavioral UML Diagrams
Behavioral UML diagrams are visual representations that depict the dynamic aspects of a system, illustrating how objects interact and behave over time in response to events.
Types of Behavioral UML Diagrams
1. State Machine Diagram
https://www.geeksforgeeks.org/unified-modeling-language-uml-state-diagrams/?ref=header_outind
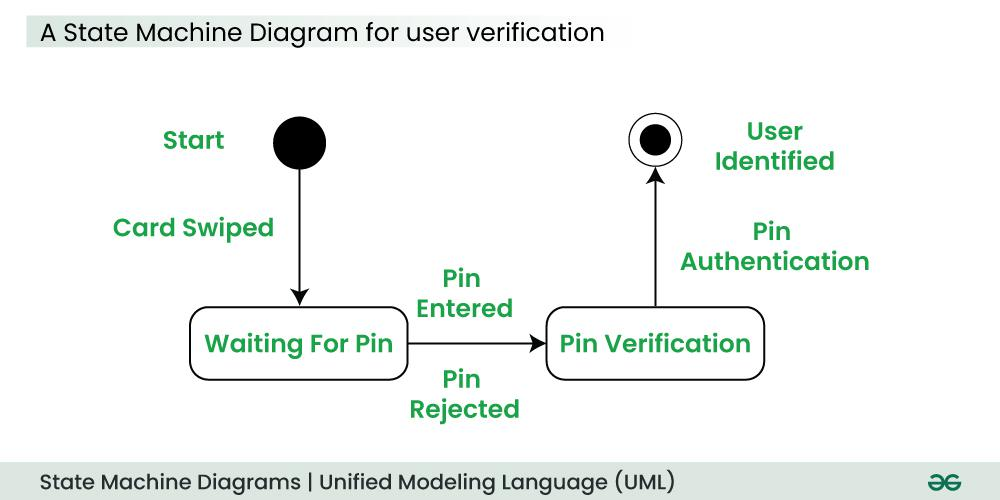
A state diagram is a uml diagram which is used to represent the condition of the system or part of the system at finite instances of time. It’s a behavioral diagram and it represents the behavior using finite state transitions.
- State Machine diagrams are also known as State Diagrams and State-Chart Diagrams. These both terms can be used interchangeably.
- A state machine diagram is used to model the dynamic behavior of a class in response to time and changing external stimuli( eventS that causes system to changes its state from one to another).
- We can say that each and every class has a state but we don’t model every class using State Machine diagrams.
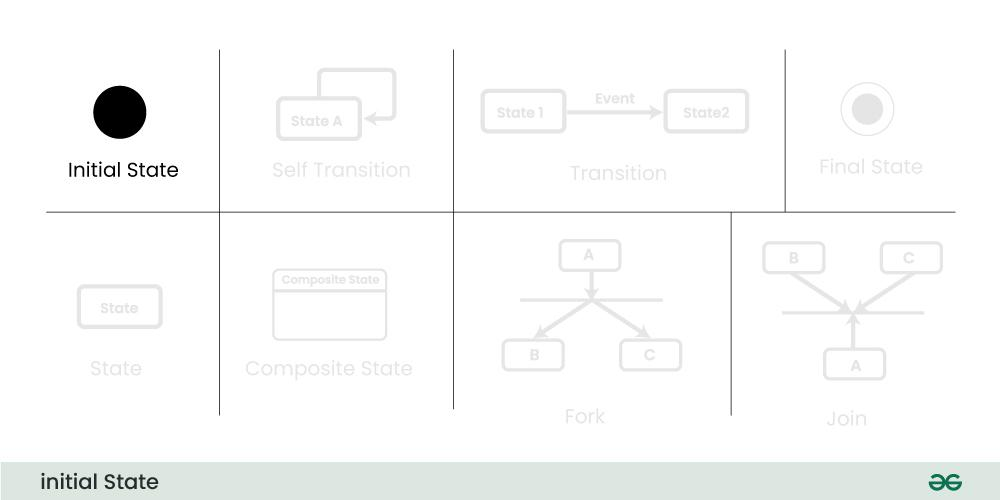
Basic components and notations of a State Machine Diagram
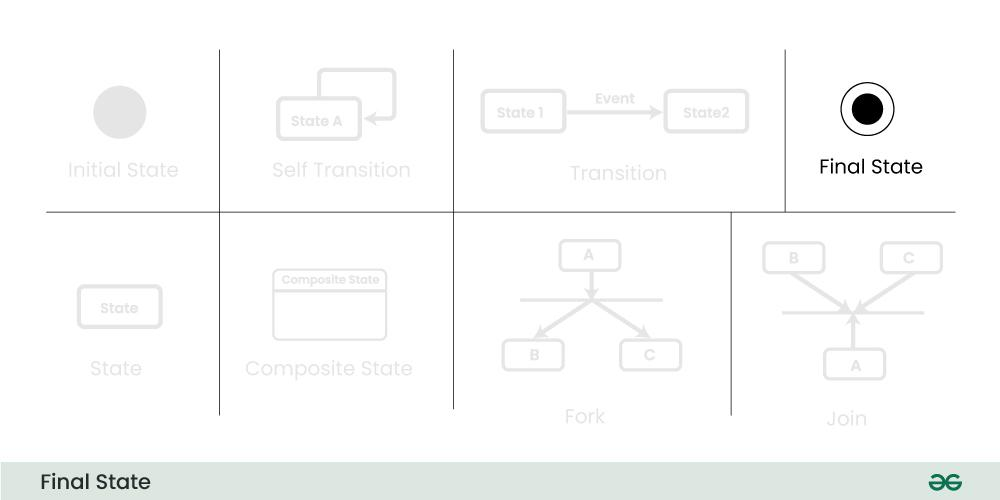
1. Initial State
We use a black filled circle represent the initial state of a System or a Class.
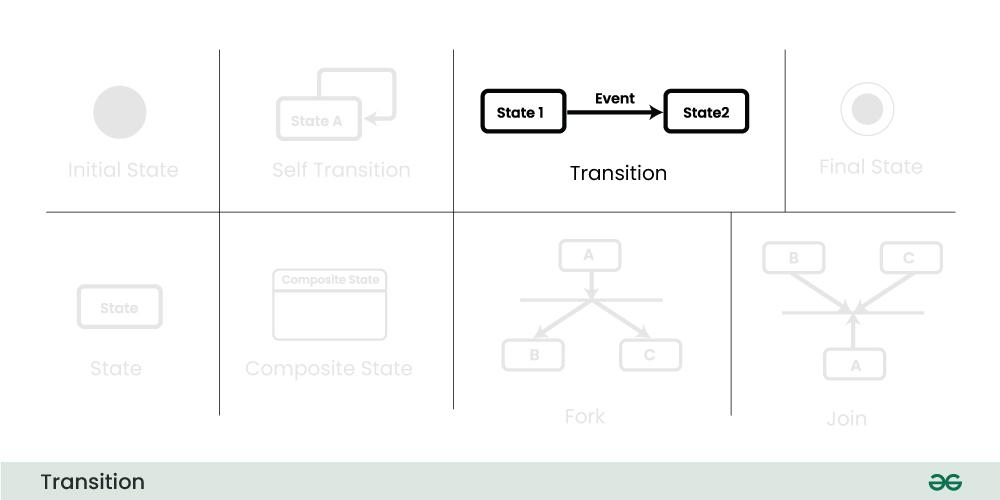
2. Transition
We use a solid arrow to represent the transition or change of control from one state to another. The arrow is labelled with the event which causes the change in state.
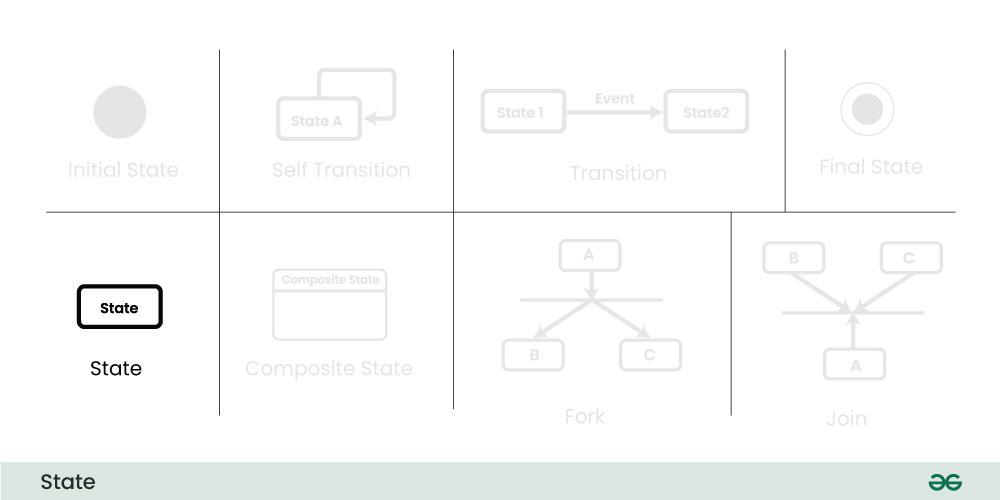
3. State
We use a rounded rectangle to represent a state. A state represents the conditions or circumstances of an object of a class at an instant of time.
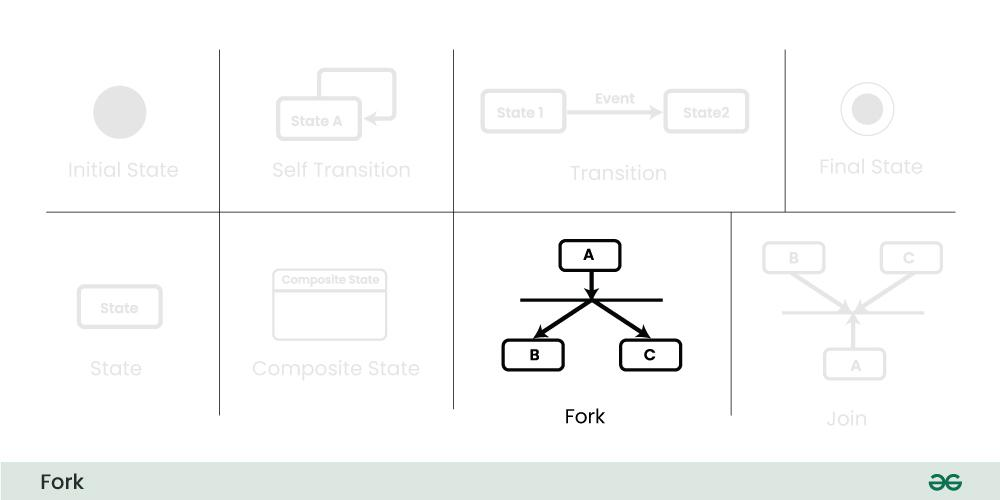
4. Fork
We use a rounded solid rectangular bar to represent a Fork notation with incoming arrow from the parent state and outgoing arrows towards the newly created states. We use the fork notation to represent a state splitting into two or more concurrent states.
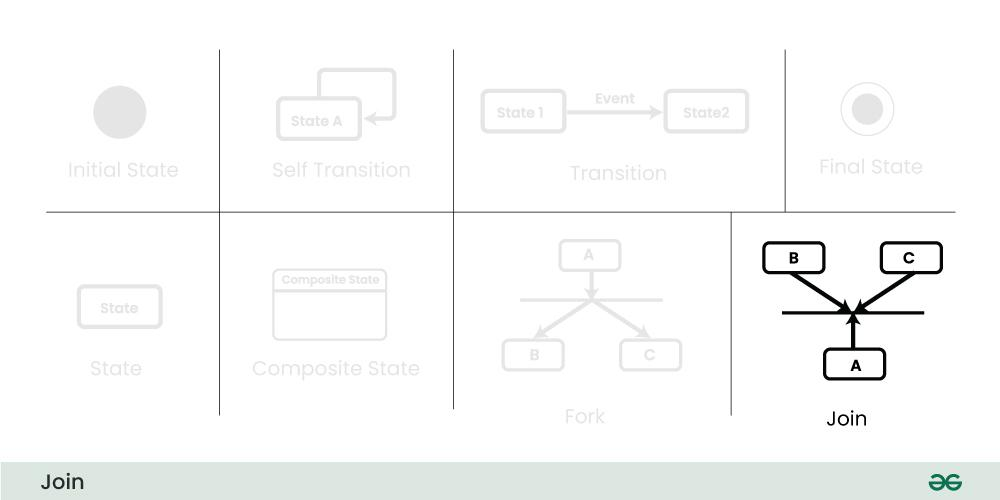
5. Join
We use a rounded solid rectangular bar to represent a Join notation with incoming arrows from the joining states and outgoing arrow towards the common goal state. We use the join notation when two or more states concurrently converge into one on the occurrence of an event or events.
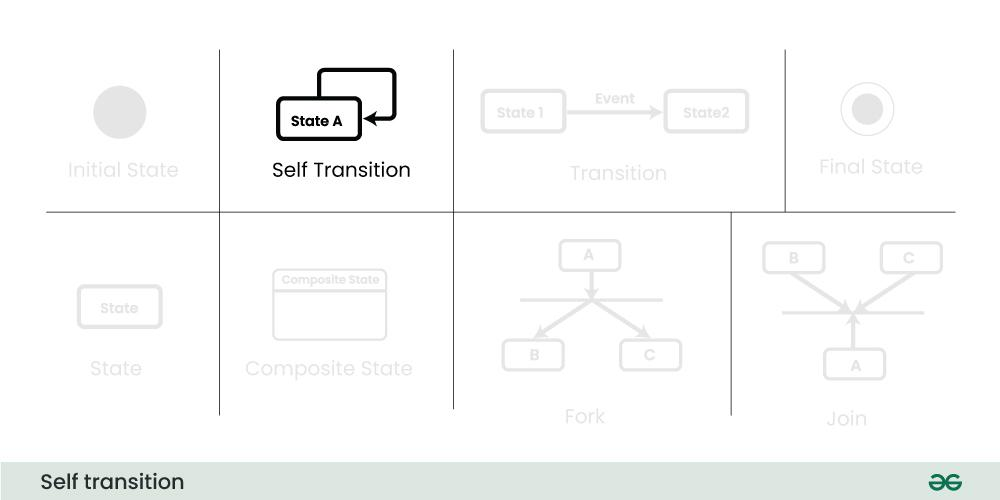
6. Self transition
We use a solid arrow pointing back to the state itself to represent a self transition. There might be scenarios when the state of the object does not change upon the occurrence of an event. We use self transitions to represent such cases.
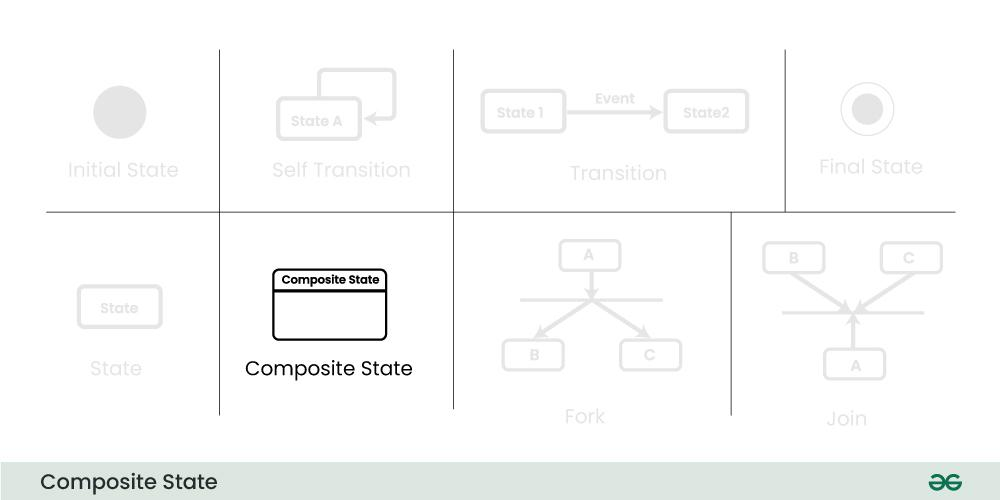
7. Composite State
We use a rounded rectangle to represent a composite state also. We represent a state with internal activities using a composite state.
8. Final State
We use a filled circle within a circle notation to represent the final state in a state machine diagram.
State Machine vs Flowchart
Below are the main differences between a state machine diagram and a flowchart:
| State Machine Diagram | Flow Chart |
|---|---|
| An State Machine Diagram is associated with the UML(Unified Modelling Language) | A Flow Chart is associated with the programming. |
| The basic purpose of a state machine diagram is to portray various changes in state of the class and not the processes or commands causing the changes. | A flowchart on the other hand portrays the processes or commands that on execution change the state of class or an object of the class. |
| Primarily used for systems, emphasizing their states and transitions. | Often used for processes, procedures, or algorithms involving actions and decisions. |
2. Activity Diagrams
Activity diagrams show the steps involved in how a system works, helping us understand the flow of control. They display the order in which activities happen and whether they occur one after the other (sequential) or at the same time (concurrent). These diagrams help explain what triggers certain actions or events in a system.
- An activity diagram starts from an initial point and ends at a final point, showing different decision paths along the way.
- They are often used in business and process modeling to show how a system behaves over time.
When to use an Activity Diagram?
Activity diagrams are useful in several scenarios, especially when you need to visually represent the flow of processes or behaviors in a system. Here are key situations when you should use an activity diagram:
- Modeling Workflows or Processes: When you need to map out a business process, workflow, or the steps involved in a use case, activity diagrams help visualize the flow of activities.
- Concurrent or Parallel Processing: If your system or process involves activities happening simultaneously, an activity diagram can clearly show the parallel flow of tasks.
- Understanding the Dynamic Behavior: When it’s essential to depict how a system changes over time and moves between different states based on events or conditions, activity diagrams are effective.
- Clarifying Complex Logic: Use an activity diagram to simplify complex decision-making processes with branching paths and different outcomes.
- System Design and Analysis: During the design phase of a software system, activity diagrams help developers and stakeholders understand how different parts of the system interact dynamically.
- Describing Use Cases: They are useful for illustrating the flow of control within a use case, showing how various components of the system interact during its execution.
Activity Diagram Notations
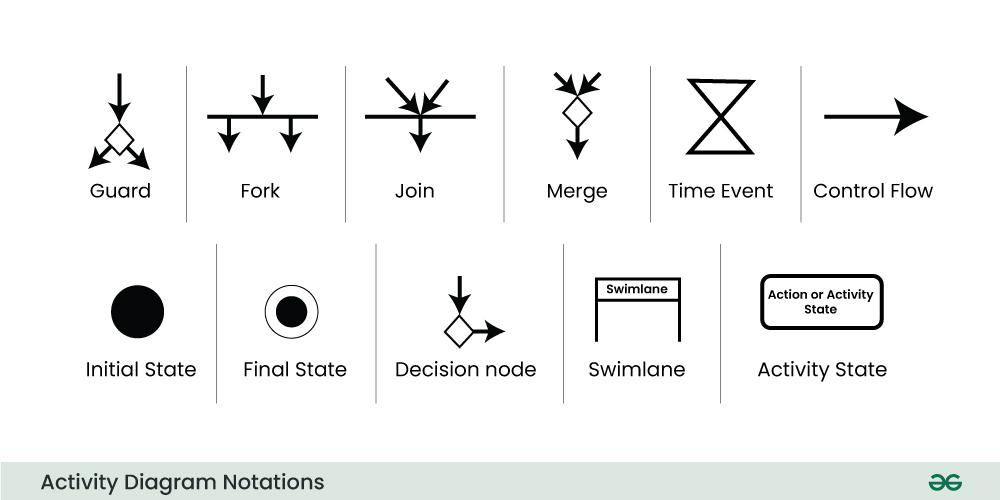
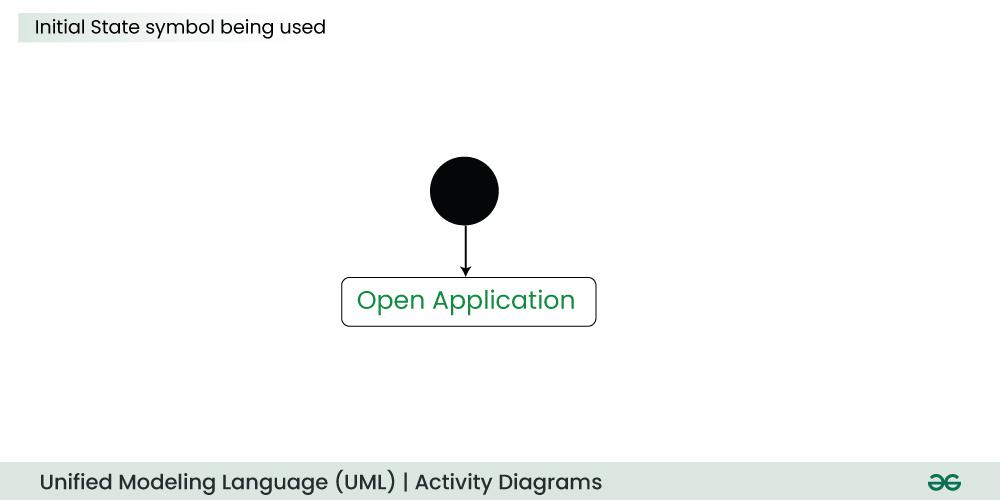
- Initial State: The starting state before an activity takes place is depicted using the initial state.
Example:
-
Action or Activity State: An activity represents execution of an action on objects or by objects. We represent an activity using a rectangle with rounded corners. Basically any action or event that takes place is represented using an activity.
-
Action flow or Control flows : Action flows or Control flows are also referred to as paths and edges. They are used to show the transition from one activity state to another activity state.
Example:
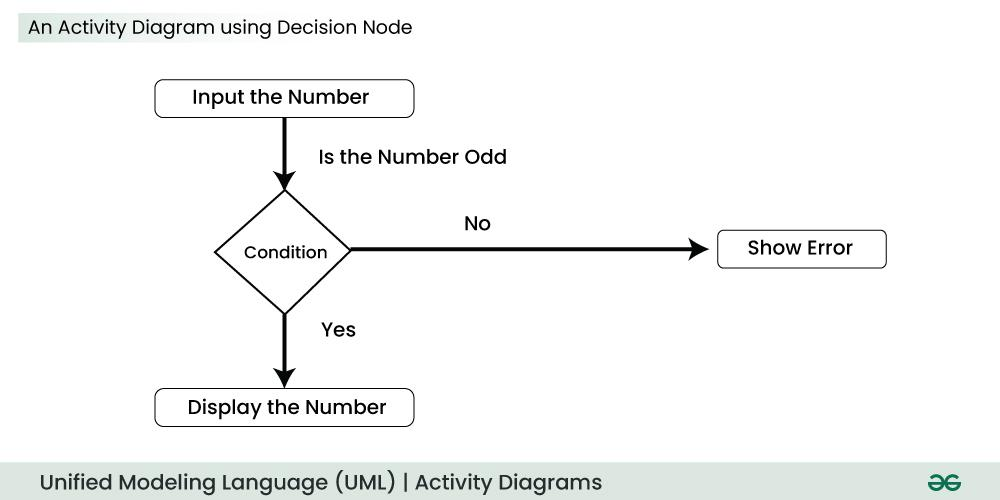
- Decision node and Branching: When we need to make a decision before deciding the flow of control, we use the decision node. The outgoing arrows from the decision node can be labelled with conditions or guard expressions. It always includes two or more output arrows.
-
Guard: A Guard refers to a statement written next to a decision node on an arrow sometimes within square brackets. The statement must be true for the control to shift along a particular direction. Guards help us know the constraints and conditions which determine the flow of a process.
-
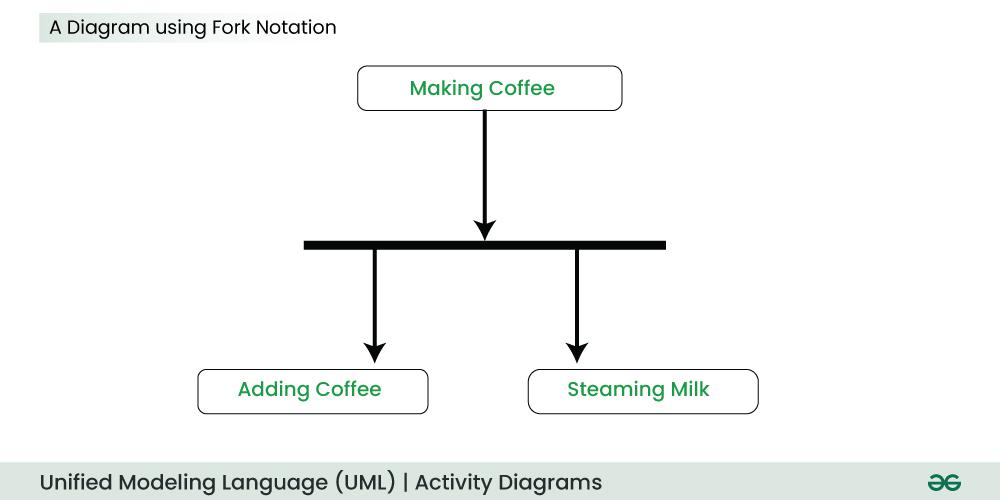
Fork: Fork nodes are used to support concurrent activities. When we use a fork node when both the activities get executed concurrently i.e. no decision is made before splitting the activity into two parts. Both parts need to be executed in case of a fork statement. We use a rounded solid rectangular bar to represent a Fork notation with incoming arrow from the parent activity state and outgoing arrows towards the newly created activities.
Example:
-
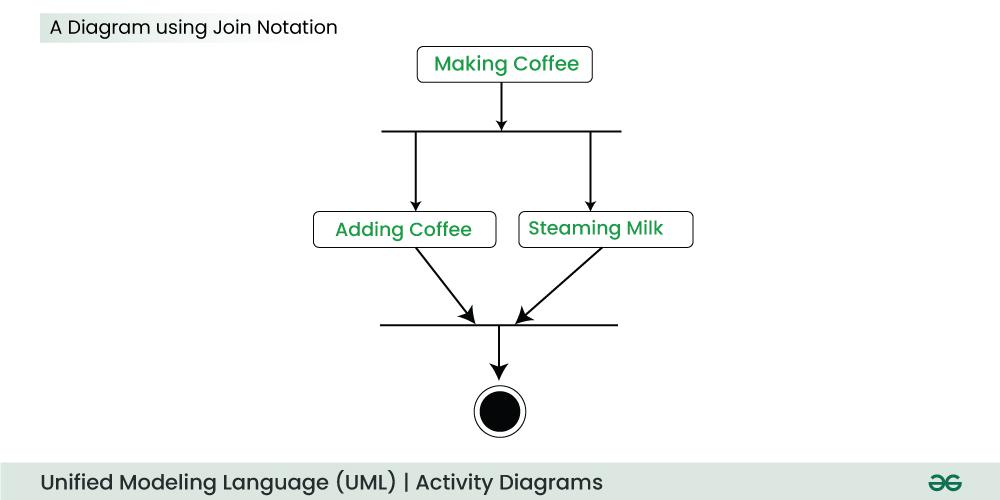
Join : Join nodes are used to support concurrent activities converging into one. For join notations we have two or more incoming edges and one outgoing edge.
Example:
-
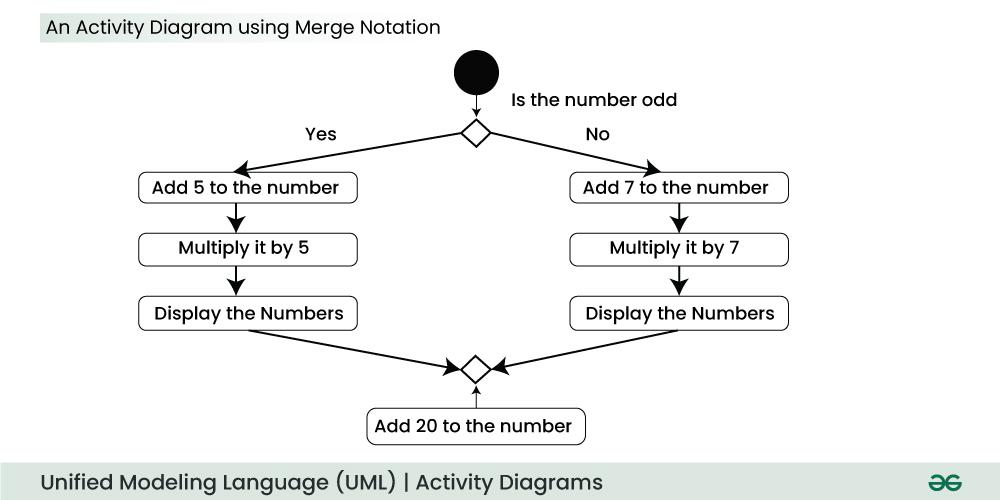
Merge or Merge Event: Scenarios arise when activities which are not being executed concurrently have to be merged. We use the merge notation for such scenarios. We can merge two or more activities into one if the control proceeds onto the next activity irrespective of the path chosen.
Example:
-
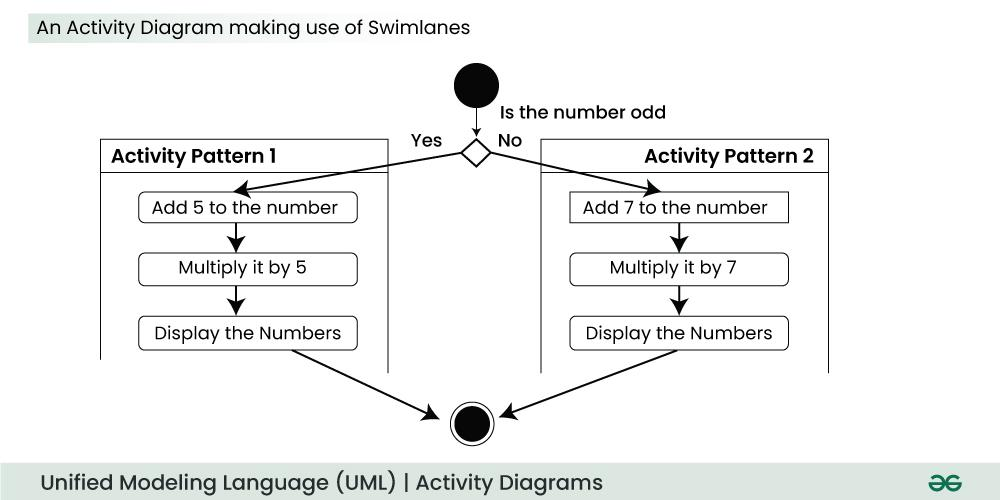
Swimlanes: We use Swimlanes for grouping related activities in one column. Swimlanes group related activities into one column or one row. Swimlanes can be vertical and horizontal. Swimlanes are used to add modularity to the activity diagram. It is not mandatory to use swimlanes. They usually give more clarity to the activity diagram.
Example:
-
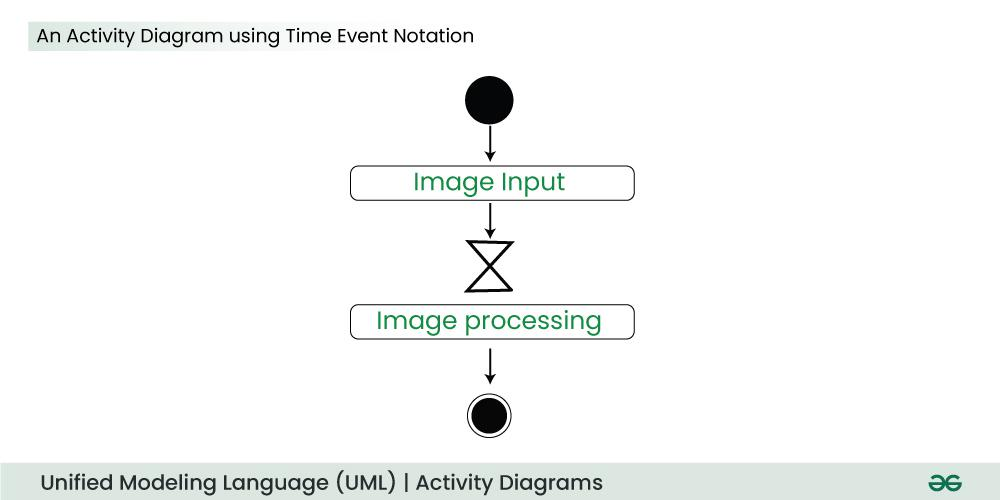
Time Event: This refers to an event that stops the flow for a time; an hourglass depicts it. We can have a scenario where an event takes some time to completed.
Example:
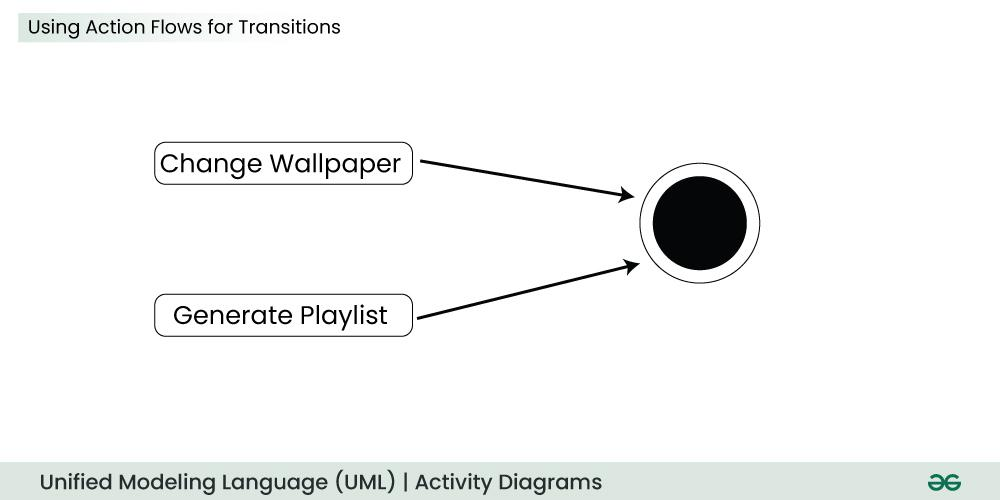
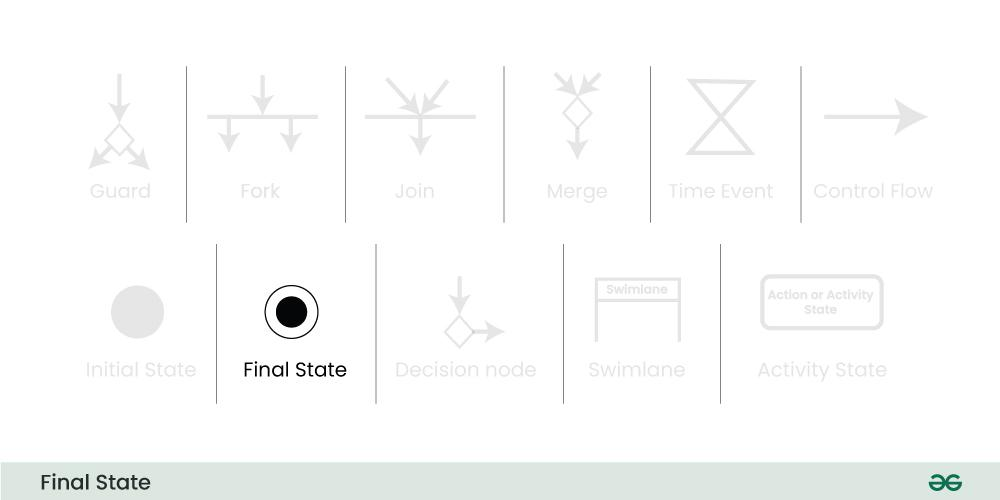
- Final State or End State: The state which the system reaches when a particular process or activity ends is known as a Final State or End State. We use a filled circle within a circle notation to represent the final state in a state machine diagram. A system or a process can have multiple final states.
Activity Diagram vs Flowchart
| Aspect | Activity Diagram | Flowchart |
|---|---|---|
| Purpose | Represents the flow of control in a system or process, focusing on activities and conditions. | Depicts the step-by-step flow of a process or algorithm, focusing on operations. |
| Used In | Primarily used in software and systems modeling, especially in UML (Unified Modeling Language). | Commonly used in various fields like programming, business, and process mapping. |
| Complexity | Can represent both simple and complex workflows, including concurrent processing. | Typically used for simpler, linear processes, though can handle limited complexity. |
| Symbols | Uses UML symbols like initial nodes, activity nodes, decisions, swimlanes, etc. | Uses basic symbols like rectangles (process), diamonds (decisions), and arrows (flow). |
| Concurrency Representation | Supports concurrent activities and parallel flows. | Does not support parallel processes explicitly; focuses on sequential flow. |
3. Use-Case Diagram
https://www.geeksforgeeks.org/use-case-diagram/
A Use Case Diagram is a type of Unified Modeling Language (UML) diagram that represents the interaction between actors (users or external systems) and a system under consideration to accomplish specific goals. It provides a high-level view of the system’s functionality by illustrating the various ways users can interact with it.
When to apply Use-Case Diagram?
- When you need to gather and clarify user requirements, use case diagrams help visualize how different users interact with the system.
- If you’re working with diverse groups, including non-technical stakeholders, these diagrams provide a clear and simple way to convey system functionality.
- During the system design phase, use case diagrams help outline user interactions and plan features, ensuring that the design aligns with user needs.
- When defining what is included in the system versus what is external, use case diagrams help clarify these boundaries.
Use-Case diagram Notations
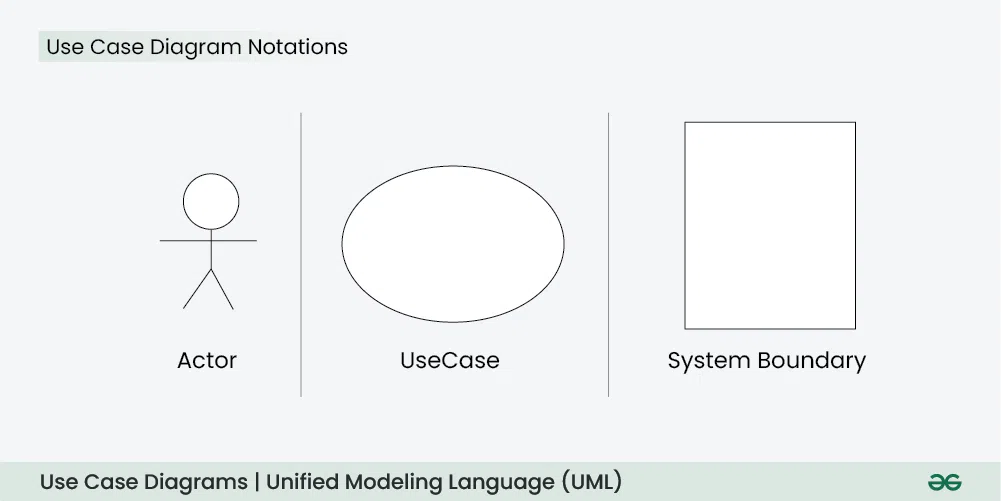
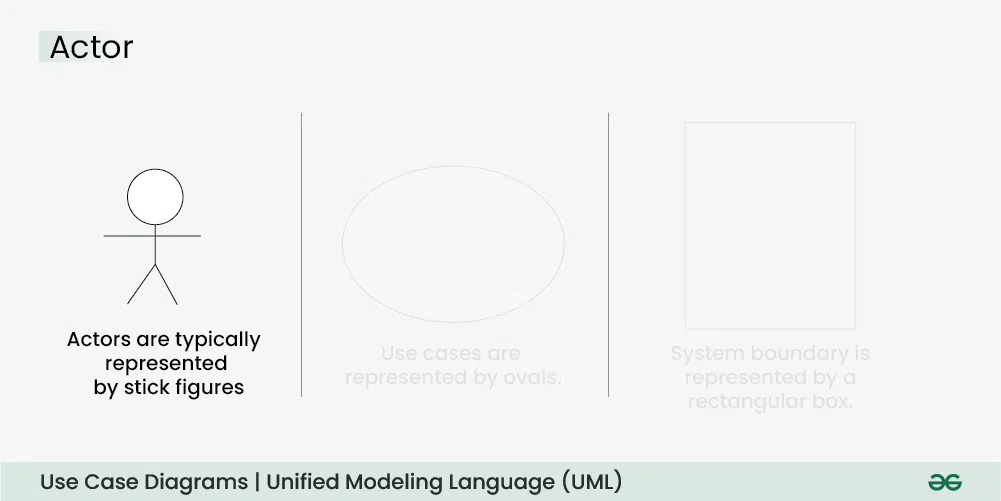
1. Actors
Actors are external entities that interact with the system. These can include users, other systems, or hardware devices. In the context of a Use Case Diagram, actors initiate use cases and receive the outcomes. Proper identification and understanding of actors are crucial for accurately modeling system behavior.
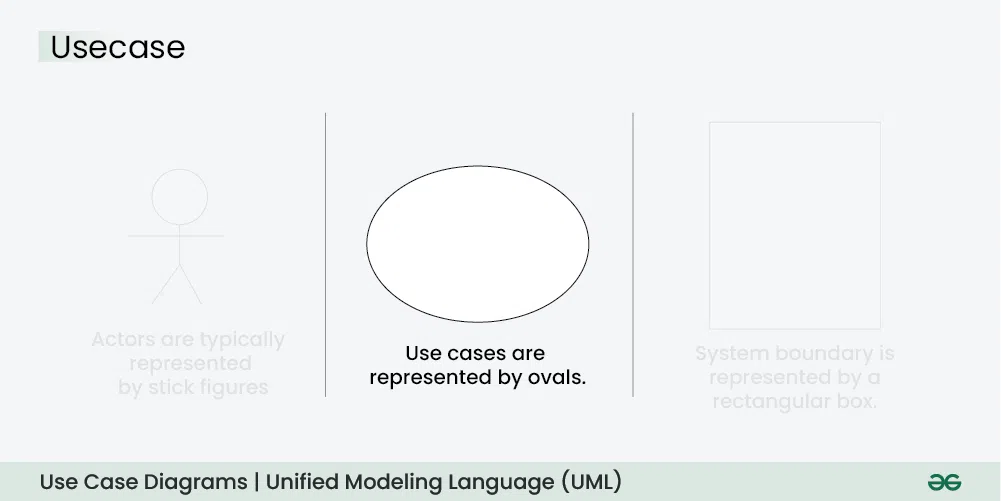
2. Use Cases
Use cases are like scenes in the play. They represent specific things your system can do. In the online shopping system, examples of use cases could be “Place Order,” “Track Delivery,” or “Update Product Information”. Use cases are represented by ovals.
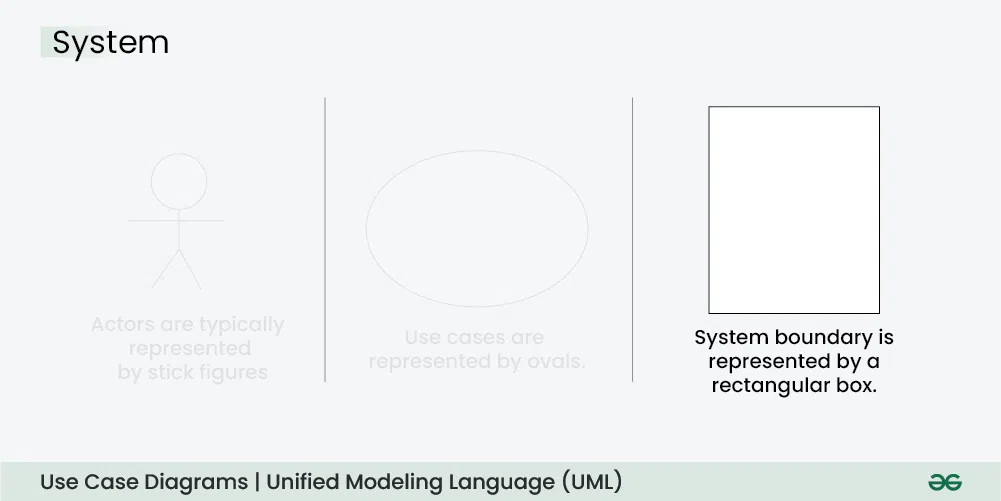
3. System Boundary
The system boundary is a visual representation of the scope or limits of the system you are modeling. It defines what is inside the system and what is outside. The boundary helps to establish a clear distinction between the elements that are part of the system and those that are external to it. The system boundary is typically represented by a rectangular box that surrounds all the use cases of the system.
Use-Case Diagram relationships
1. Include relationship
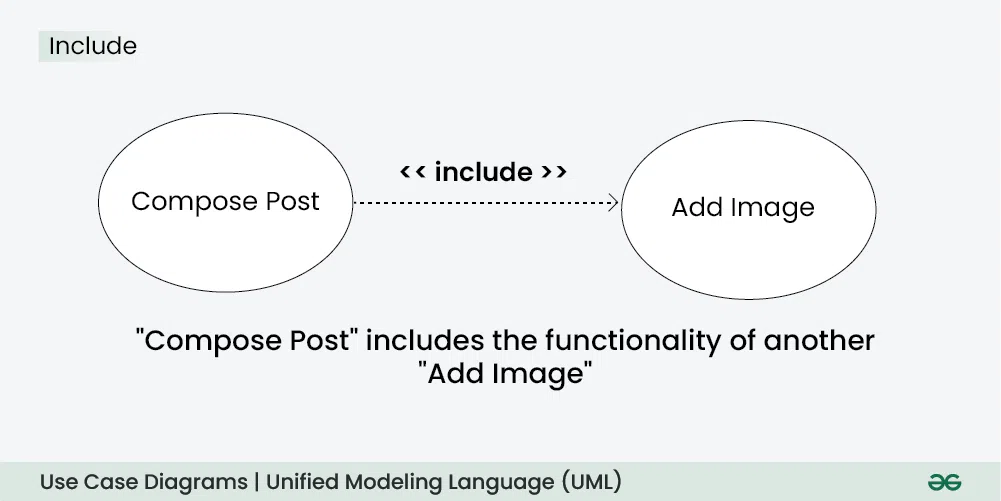
The Include Relationship indicates that a use case includes the functionality of another use case. It is denoted by a dashed arrow pointing from the including use case to the included use case. This relationship promotes modular and reusable design.
- Use Cases: Compose Post, Add Image
- Include Relationship: The “Compose Post” use case includes the functionality of “Add Image.” Therefore, composing a post includes the action of adding an image.
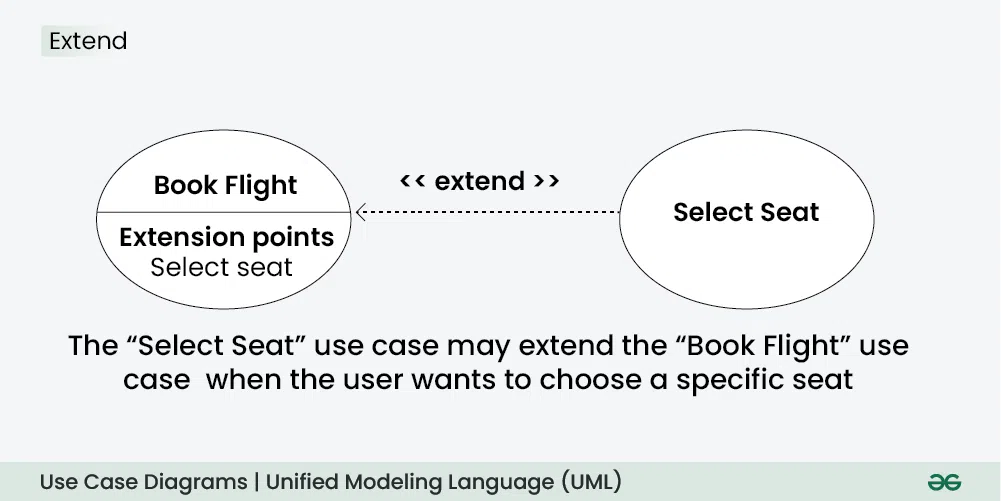
2. Exclude relationship
The Extend Relationship illustrates that a use case can be extended by another use case under specific conditions. It is represented by a dashed arrow with the keyword “extend.” This relationship is useful for handling optional or exceptional behavior.
- Use Cases: Book Flight, Select Seat
- Extend Relationship: The “Select Seat” use case may extend the “Book Flight” use case when the user wants to choose a specific seat, but it is an optional step.
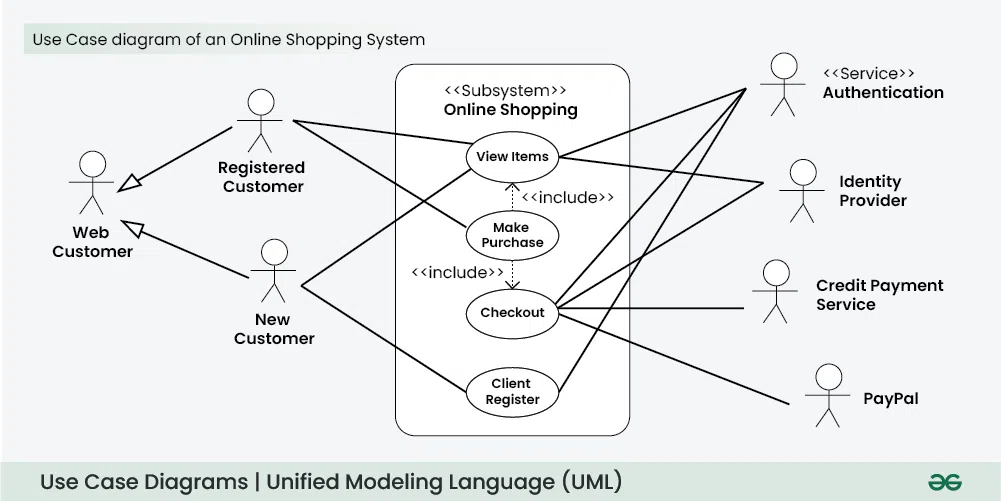
Example of a Use-Case diagram (Online Shopping System)
Let’s understand how to draw a Use Case diagram with the help of an Online Shopping System:
- Actors:
- Customer
- Admin
- Use Cases:
- Browse Products
- Add to Cart
- Checkout
- Manage Inventory (Admin)
- Relations:
- The Customer can browse products, add to the cart, and complete the checkout.
- The Admin can manage the inventory.
4. Sequence Diagram
https://www.geeksforgeeks.org/unified-modeling-language-uml-sequence-diagrams/
5. Communication Diagram
A Communication Diagram (known as Collaboration Diagram in UML 1.x) is used to show sequenced messages exchanged between objects.
- A communication diagram focuses primarily on objects and their relationships.
- We can represent similar information using Sequence diagrams, however communication diagrams represent objects and links in a free form.
6. Timing Diagram
Timing Diagram are a special form of Sequence diagrams which are used to depict the behavior of objects over a time frame. We use them to show time and duration constraints which govern changes in states and behavior of objects.
7. Interaction Overview Diagram
An Interaction Overview Diagram (IOD) is a type of UML (Unified Modeling Language) diagram that illustrates the flow of interactions between various elements in a system or process. It provides a high-level overview of how interactions occur, including the sequence of actions, decisions, and interactions between different components or objects.
https://www.geeksforgeeks.org/interaction-overview-diagrams-unified-modeling-language-uml/