Index
- What is Data Warehousing?
- ETL (Extract, Transform, Load) — Data Aggregation in Data Warehousing
- 4. OLTP vs OLAP (Database vs Data Warehouse
- 5. Data Warehouse Architecture
- Star Schema vs Snowflake Schema
- Data Mining
- Data Mining Techniques
- Mining Frequent Patterns, Associations, and Correlations
- Association Rules — More Than Co-Occurrence
- Correlation — Relationship Beyond Co-Occurrence
- Sequential Pattern Mining
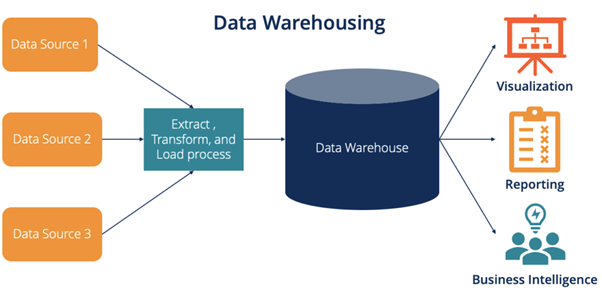
What is Data Warehousing?
A Data Warehouse (DW) is a centralized, integrated system designed for querying and analyzing data, not for daily operations.
It collects data from multiple sources — like databases, flat files, logs — and stores it in a consistent, cleaned, and structured form, optimized for analysis and reporting.
2. Why Do We Need Data Warehousing?
Imagine you run a large company:
-
You have data from sales, customer feedback, marketing, and inventory.
-
Each of these is stored in different databases.
-
To make smart decisions, you need all this data in one place, ready for fast analysis.
That’s the job of the Data Warehouse —
A single source of truth for decision-makers.
3. Data Warehousing Components:
-
Source Data:
Where data originates (e.g., CRM, ERP, logs). -
ETL Process (Extract, Transform, Load):
-
Extract: Pull data from source.
-
Transform: Clean, format, and combine data.
-
Load: Store it in the warehouse.
-
-
Data Storage:
Structured tables designed for analysis (Star Schema, Snowflake Schema). -
Data Presentation/Access:
Tools like Power BI, Tableau, or SQL queries used for insights.
ETL (Extract, Transform, Load) — Data Aggregation in Data Warehousing
https://www.youtube.com/watch?v=Tq8oCFjP6kQ&list=PLxCzCOWd7aiHexyDzYgry0YZN29e7HdNB&index=3
What is ETL?
ETL stands for:
-
Extract – pulling data from various sources
-
Transform – cleaning, validating, formatting, and structuring the data
-
Load – putting the processed data into a data warehouse
The speaker emphasizes that ETL isn’t just a concept; it’s a real-world process executed by companies, especially when they work with data warehousing.
Step 1: Extract
What It Means:
The extraction step is about collecting raw data from multiple sources. These could be:
-
Retail store databases
-
Flat files (CSV, Excel)
-
Legacy systems
-
Web APIs
-
Structured or unstructured data (even video/audio, technically)
Example 1: Reliance Retail Stores
-
Reliance has over 2500 stores (like Reliance Fresh, Big Bazaar).
-
Each store generates daily transactions: What was sold, product ID, price, store location, customer number, amount, etc.
-
This is transactional data, and millions of such records are generated daily.
-
It’s not feasible to store all of this locally at each store. So the company collects and integrates this data centrally.
-
This is where extraction comes in – bringing in data from all stores at a fixed time (like 8 PM daily).
Example 2: Bank Mergers (e.g., SBI)
-
SBI merged with several regional banks (State Bank of Patiala, Hyderabad, Mysore, etc.).
-
Each had its own customer and transaction data.
-
That data needed to be extracted and unified into one system for SBI.
Step 2: Transform
What It Means:
This is the cleaning and organizing stage. Once the data is extracted and integrated, we:
- Validate it (check for missing values, integrity issues)
- Remove duplicates (e.g., a ₹10 crore sale mistakenly counted 10 times = ₹100 crore!)
- Standardize formats (e.g., INR vs USD, date formats, time zones)
- Join and filter data
- Aggregate totals (like total sales per day)
Key Concepts:
-
Validation Rules: Ensure no incomplete or missing records. Check referential integrity (e.g., primary keys and foreign keys are correct).
-
Data Cleaning: Remove nulls, fix errors, convert formats (e.g., currency, timestamps).
-
Data Modeling:
-
Convert data into formats that fit your data warehouse.
-
Examples:
-
Star schema
-
Snowflake schema
-
Use columnar databases or RDBMS tables as needed.
-
-
Step 3: Load
What It Means:
Finally, the clean and transformed data is loaded into the data warehouse. This is where it becomes available for:
-
Business intelligence
-
Reports
-
Decision making
You shouldn’t load dirty or raw data, because:
-
It would corrupt analytics.
-
It gives wrong results later.
By ensuring quality data at this step, future decisions are based on accurate, meaningful information.
Tools Used
ETL tools used in the industry:
-
Microsoft SSIS (SQL Server Integration Services)
-
Informatica PowerCenter
-
Apache Spark (for real-time or large-scale transformations)
Summary
| Step | Description | Real-life Examples |
|---|---|---|
| Extract | Pull raw data from different sources | Reliance stores, merged banks |
| Transform | Clean, format, validate, structure the data | Remove duplicates, fix currencies |
| Load | Store into a central warehouse | Clean data goes into data warehouse for reporting |
Why ETL is Important?
-
Helps businesses unify data from different systems
-
Allows centralized analysis and reporting
-
Ensures quality and accurate data for decisions
4. OLTP vs OLAP (Database vs Data Warehouse
https://www.youtube.com/watch?v=DVVIRw7GG5c&list=PLxCzCOWd7aiHexyDzYgry0YZN29e7HdNB&index=7
https://www.youtube.com/watch?v=DeL3dgiy6vk&list=PLxCzCOWd7aiHexyDzYgry0YZN29e7HdNB&index=8
| Feature | OLTP (Online Transaction Processing) | OLAP (Online Analytical Processing) |
|---|---|---|
| Purpose | Day-to-day operations | Decision-making and analytics |
| Data Type | Highly detailed, real-time data | Summarized, historical data |
| Examples | Banking transactions, e-commerce checkout | Sales trends, customer segmentation |
| Operations | Insert, Update, Delete | Complex Queries, Aggregations |
| Storage Design | Normalized | Denormalized (Star/Snowflake schema) |
Difference between Database and Data Warehouse
OLTP Database
A database is designed to capture and record data from a variety of enterprise systems i.e. OLTP - Online Transaction Processing. OLTP includes resource planning, customer relationships, transaction management etc. OLTP database is an operational database which contains highly detailed live, real-time data.
These databases should operate consistently for the success of a business and there should be no error or ambiguity in the data that is being stored. The transactions stored in the OLTP databases are simple and direct which can be queried with speed and ease. However, databases work slowly for querying large amounts of data and can slowdown the transactional process which negatively affects the business.
OLAP Data Warehouse
On the other hand, data warehouses are designed to store summarized data from various databases or sources after transforming the data according to the business necessity for analysis, reporting and decision making, i.e. OLAP - Online Analytical Processing. Since data from various sources is stored in a warehouse, the structure of a warehouse should be thoroughly pre-planned.
Querying huge amounts of data is easy with data warehouses, and it does not generally affect business as fresh data is generally not dynamically stored in the data warehouse, rather data is updated periodically. Data stored is secure, reliable and can be easily managed and retrieved.
A simply analogy would be:
-
OLTP: Cash register at a shop.
-
OLAP: Monthly sales report for the shop’s owner.
Data Warehouses are built for OLAP.
5. Data Warehouse Architecture
https://forum.guvi.in/posts/30498/data-warehousing
Data warehouse architecture comes in three types:
- Two-tier
- Three-tier
- Four-tier
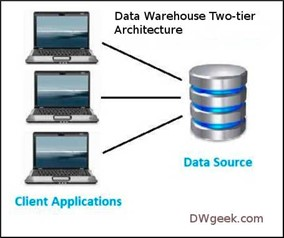
### Two-tier architecture:
Two-tier architecture is basically a client-server architecture. The end users are directly communicating with data sources. It is easy to maintain, and the communication is fast as there is no mediator in between.
In this type of architecture, the performance of the warehouse decreases when the number of end users increases, and it is also cost-ineffective.
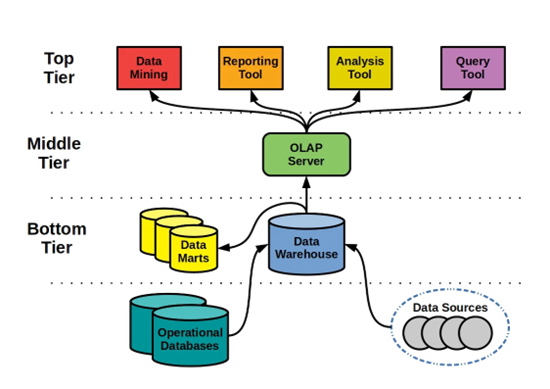
Three-tier architecture (Similar to the 3-schema architecture from DBMS)
Three-tier architecture has three layers. The top tier, middle tier and bottom tier. The top tier is the User layer, which allows users to retrieve data from the data warehouse and analyze, generate visualizations and share insights with the team. The middle tier is the OLAP layer, which acts as an interface between the User and Data layer, enhances the communication speed and processes large volumes of data. The bottom tier is the data layer that has the actual databases, and all RDBMS actions are performed in this layer.
The three-tier architecture improves performance as load is reduced on the User and Data layer. This architecture provides improved security as users do not have direct access to the database.
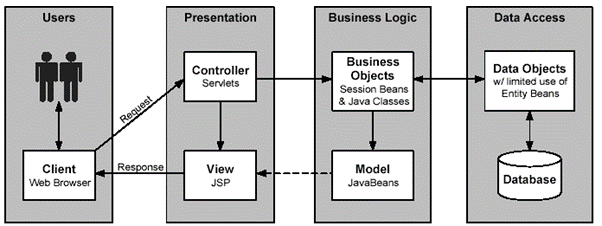
Four-tier architecture:
In four-tier architecture, a Presentation layer is included in addition to the layers present in the three-tier architecture. When users want to retrieve certain data from the warehouse, requests are sent from the user layer to the presentation layer which interacts with the business layer/OLAP layer which in turn accesses the data warehouse and the retrieved data is sent as a response to the user. The advantage of having a presentation layer is that it enhances the way the data is presented to the end user.
Star Schema vs Snowflake Schema
1. Star Schema
https://www.datacamp.com/blog/star-schema-vs-snowflake-schema
https://www.youtube.com/watch?v=ot-2GXJXYMM&list=PLxCzCOWd7aiHexyDzYgry0YZN29e7HdNB&index=5
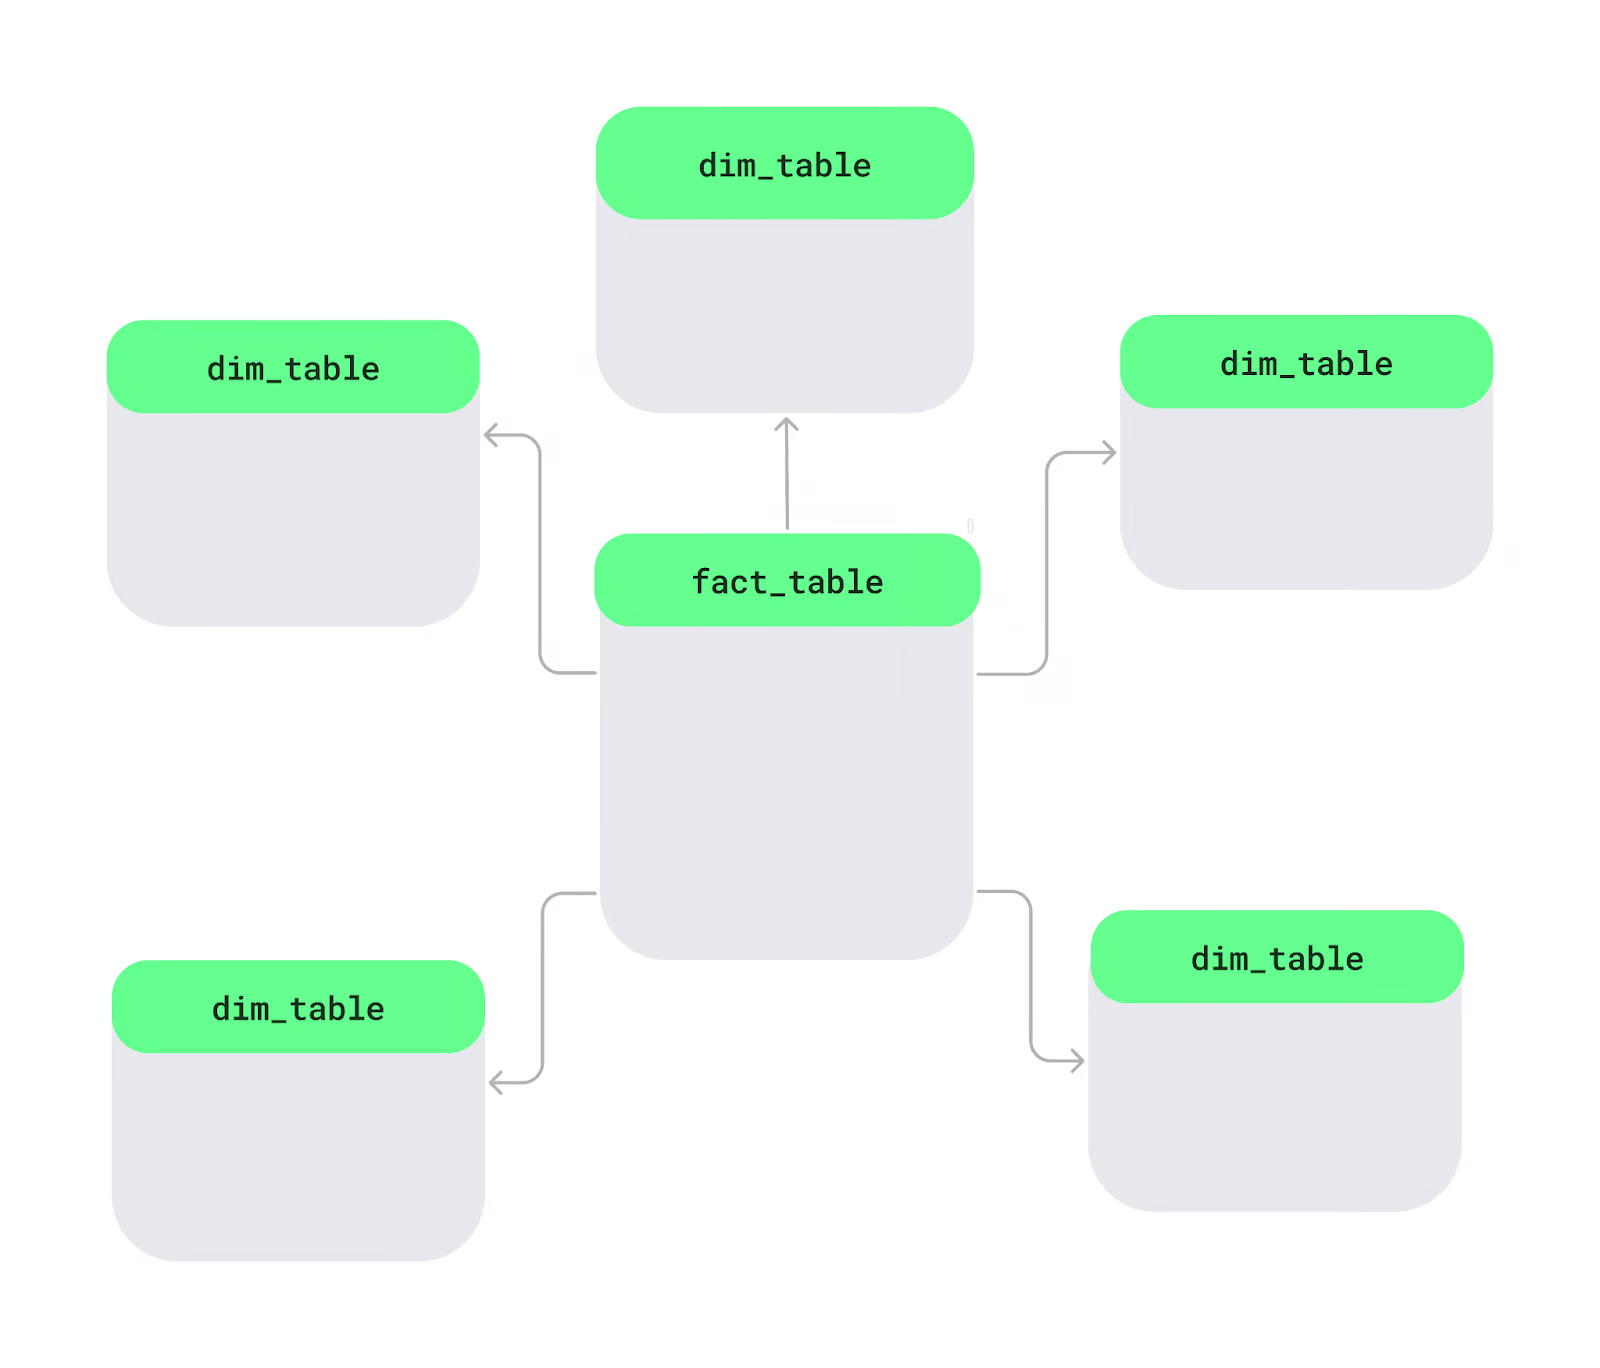
A star schema is a way to organize data in a database, especially in data warehouses, to make it easier and faster to analyze. At the center, there's a main table called the fact table, which holds measurable data like sales or revenue. Around it are dimension tables, which add details like product names, customer info, or dates. This layout forms a star-like shape.
Let’s look at the key features of the star schema:
- Single-level dimension tables: The dimension tables connect directly to the fact table without extra layers. Each table focuses on one area, like products, regions, or time, making it simple to use.
- De-normalized design: In a star schema, related data is stored together in one table using a de-normalized approach. For example, a product table may include the product ID, name, and category in the same place. While this may mean some data repetition, it processes queries faster.
- Common in data warehousing: The star schema is used for quick analysis. It can easily filter or calculate totals, so it’s likely a good choice for data warehouses where fast insights are required.
Let’s understand this further with an example :
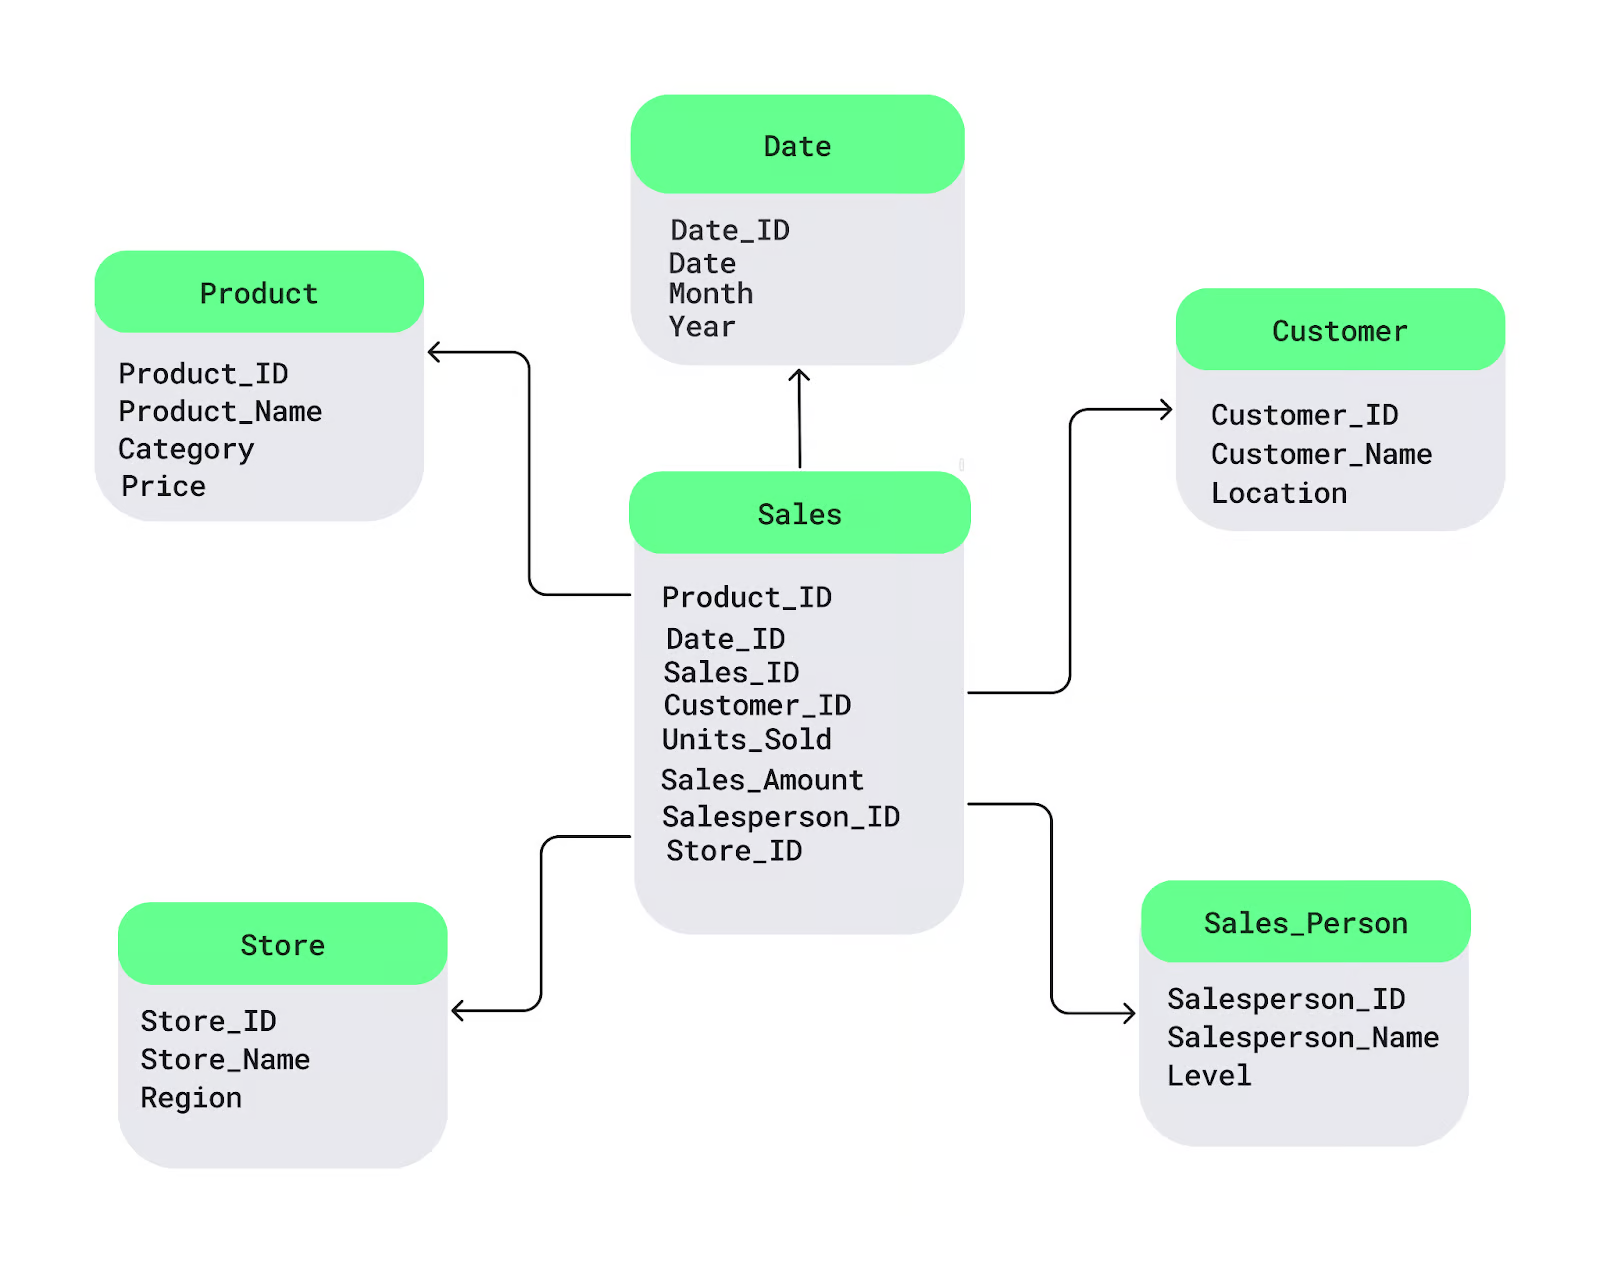
The fact table Sales is in the center. It holds the numeric data you want to analyze, like sales or profits. Connected to it are dimension tables with descriptive details, such as product names, customer location, or dates:
Advantages and limitations of a star schema
Now that you know what star schema is, let’s look at why it stands out:
-
Faster query performance: The star schema simplifies data retrieval by making queries fast. For example, if I want to look at sales trends, I will join the fact table with the right dimension tables. And the best part is that I will do all this without dealing with complex relationships. This would make my queries run faster and save me a lot of time.
-
Easy to understand: Its structure is logical and simple to understand, even for non-technical users. New team members can quickly understand which tables contain the data they need, speeding up analysis and simplifying maintenance.
2. Snowflake Schema
https://www.youtube.com/watch?v=3LcjuLb3Vy8&list=PLxCzCOWd7aiHexyDzYgry0YZN29e7HdNB&index=6
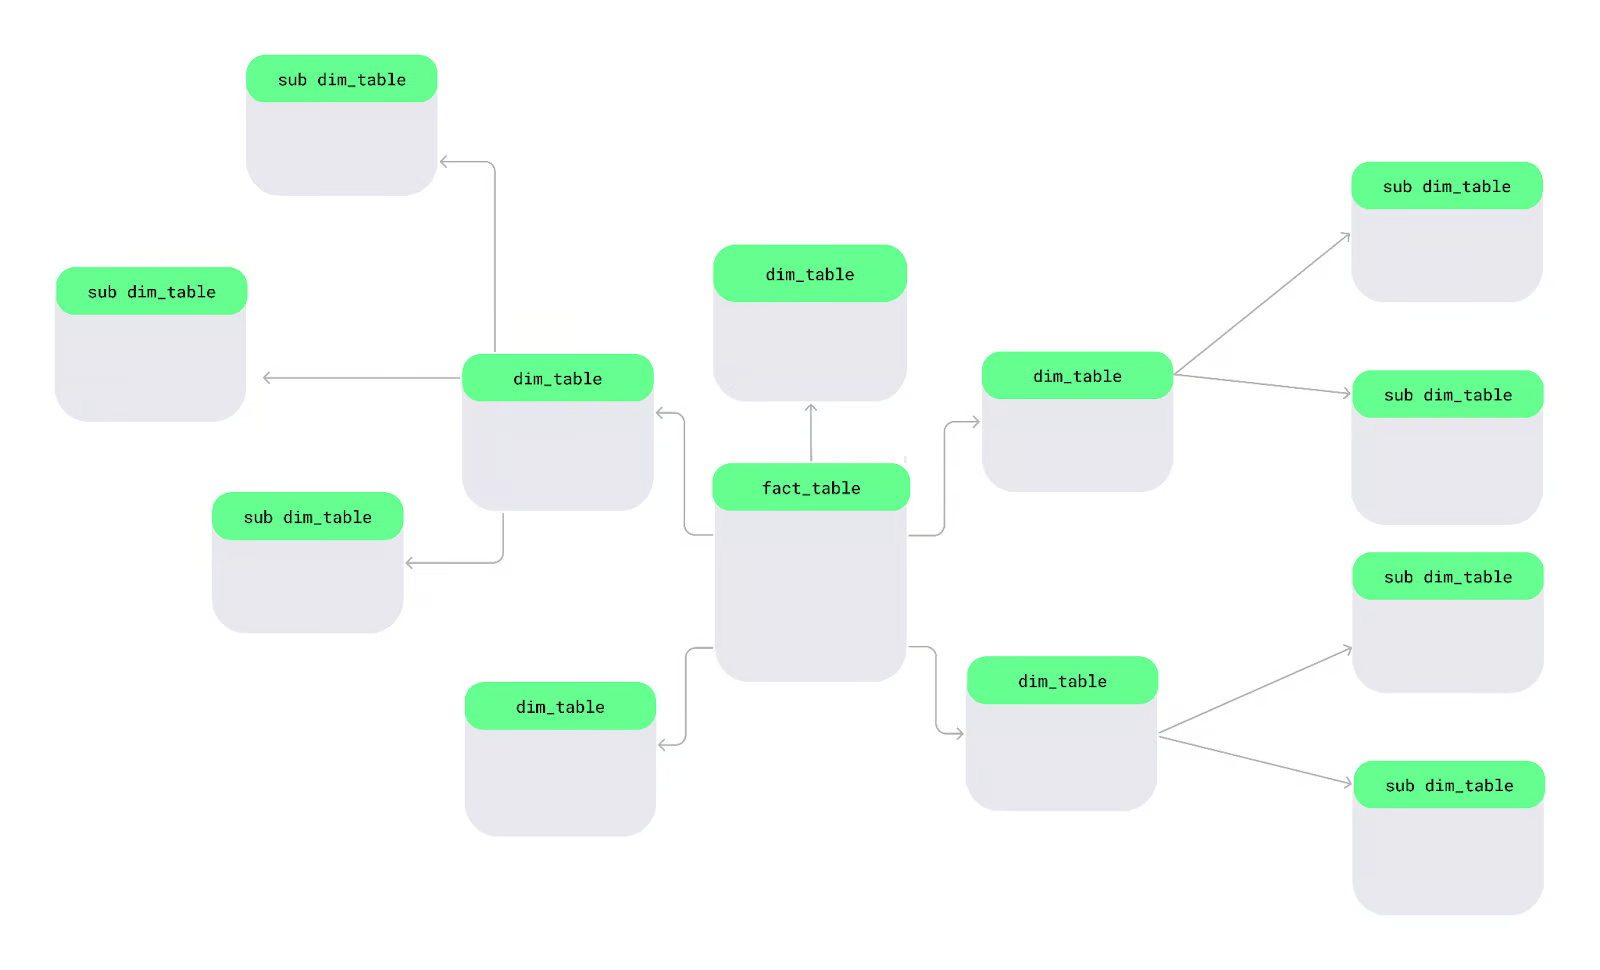
A snowflake schema is another way of organizing data. In this schema, dimension tables are split into smaller sub-dimensions to keep data more organized and detailed — just like snowflakes in a large lake.
Let’s look at the key features of the snowflake schema that make it different from other schemas:
- Multi-level dimension tables: We can break down our dimension tables into smaller, more specific tables. For example, if I want to track store locations, instead of putting all location details in one big table, I can split them into separate tables for countries, states, and cities. This way, each table would contain only the information it needs to reduce redundancy and improve organization.
- Normalization for storage efficiency: Unlike star schema, the snowflake schema follows a normalized design, which avoids data duplication. For example, rather than repeating a product category like
Electronicsfor every product, I can store the category in a separate table and link it to individual products. - Suitability for complex data environments: The snowflake schema works best for complex data environments because it uses multi-level tables to handle intricate relationships and hierarchical data structures.
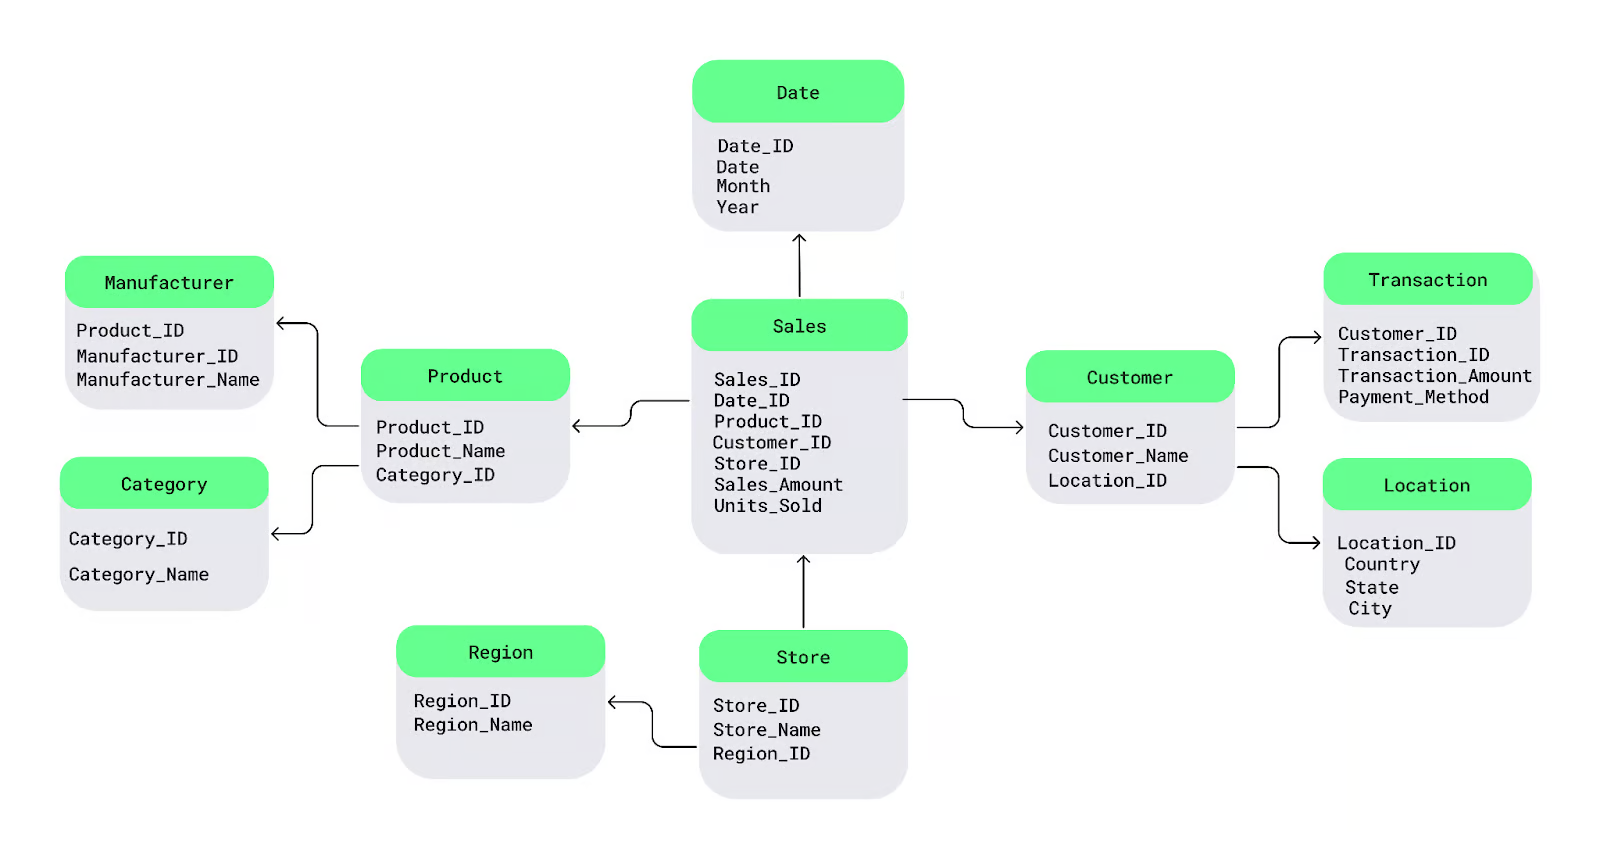
Let’s understand this with a simple snowflake schema diagram. At the center is the fact table, which contains measurable data. It connects to dimension tables that describe the facts, and these dimension tables further branch out into sub-dimension tables, forming a snowflake-like structure.
For example, here I split the Product into Manufacturer and Category tables and the Customer table into Transaction and Location tables:
Advantages and limitations of a snowflake schema
Like star schema, snowflake schema also has its own advantages. Let’s see what they are:
- Less data redundancy: Normalization ensures that the same data is not stored multiple times, which reduces duplication.
- Efficient storage for large datasets: This schema saves storage space by avoiding repeated data, making it ideal for managing large datasets.
However, despite its advantages, there are a few limitations too. For example, queries can be slower because there are more joins between tables. Apart from this, the multi-level structure is more challenging to design and maintain than simpler schemas like star schema.
When to Use a Star Schema
If you primarily want to organize your data simply and quickly, the star schema would be perfect. Here’s when you can use it:
- If you want to run simple queries like finding total sales by region, use star schema. Since all the dimension tables connect directly to the fact table, it avoids unnecessary complexity and delivers answers faster.
- You can even use star schema when speed is your priority. It minimizes the number of table joins, so your queries run faster. I used it once to generate several sales reports, saving me so much time compared to other designs.
- If your dataset is small to medium, the star schema’s redundancy won’t be a problem. Even with repeated data, it’d work fine without overwhelming your storage.
When to Use a Snowflake Schema
Snowflake schema is more suitable for handling frequent updates or organizing detailed hierarchies. Here’s when you can use it:
- Use the snowflake schema if you work with large datasets and want to save storage space. It normalizes dimension tables to prevent repeated data, which reduces storage requirements.
- You can even use the snowflake schema if your data changes often, like updating region names. It maintains consistent updates across all related data to minimize errors and maintenance efforts.
- If your analysis involves multiple levels of data, the snowflake schema can help you organize and represent these relationships in a simple way.
Summary Table: Star Schema vs. Snowflake Schema
| Feature | Star schema | Snowflake schema |
| Structure | Central fact table linked to denormalized dimensions | Central fact table linked to normalized dimensions |
| Complexity | Simple, with fewer joins | Complex, with more joins |
| Data redundancy | Higher redundancy due to denormalized dimensions | Lower redundancy due to normalized dimensions |
| Query performance | Faster queries due to simpler structure | Slower queries because of additional joins |
| Storage | Requires more storage because of redundancy | Requires less storage due to normalization |
| Ease of maintenance | Easier to design and maintain | More complex to design and maintain |
| Best suited for | Small to medium-sized datasets | Large and complex datasets |
6. Use Cases of Data Warehousing:
-
Business Intelligence reports.
-
Customer trend analysis.
-
Risk and fraud detection.
-
Marketing strategy planning.
Data Mining
Data Mining is the computational process of exploring and analyzing large volumes of data to uncover meaningful patterns, trends, correlations, or anomalies that can help in decision-making.
It’s sometimes called Knowledge Discovery in Databases (KDD) — because the goal is to extract knowledge from raw, unstructured, or massive datasets.
💡 Difference: Data Mining vs KDD
KDD is the entire process from data collection to knowledge interpretation.
Data Mining is one step inside KDD — the core analysis part.
| Stage | Purpose |
|---|---|
| Data Selection | Choose relevant data |
| Data Preprocessing | Cleanse and handle missing values |
| Data Transformation | Convert into correct formats |
| Data Mining | Discover patterns using algorithms |
| Interpretation/Evaluation | Make sense of results |
Key Characteristics of Data Mining:
-
Automatic or Semi-Automatic: Algorithms do the heavy lifting.
-
Handles Large Volumes: Can process terabytes of historical data.
-
Predictive Power: Can forecast future outcomes.
-
Interdisciplinary: Uses ideas from statistics, AI, machine learning, databases.
💡 Example to Lock It In:
Supermarket Scenario:
Imagine you own a large chain of supermarkets. Your databases log millions of transactions daily.
You might use Data Mining to find patterns like:
- “Customers who buy bread and peanut butter are 80% likely to also buy jam.”
This insight lets you:
-
Offer bundle deals.
-
Rearrange shelves to increase sales.
-
Optimize stock inventory.
Core Functions of Data Mining:
| Function | Description | Example |
|---|---|---|
| Classification | Assign items to predefined categories. | Email → Spam or Not Spam. |
| Clustering | Group similar items together without labels. | Grouping customers by purchase behavior. |
| Association Rule Mining | Find rules about co-occurrence of items. | Bread → Jam (Market Basket Analysis). |
| Prediction | Estimate future outcomes based on patterns. | Predict stock prices. |
| Outlier Detection | Identify anomalies or unusual patterns. | Fraud detection in banking. |
| Regression | Predict continuous numerical values. | Forecast next month’s sales. |
Data Mining Techniques:
-
Decision Trees: Flowchart-like structure for decision making.
-
K-Means Clustering: Groups data points into ‘K’ clusters.
-
Apriori Algorithm: Popular for association rule mining.
-
Neural Networks: Models inspired by the human brain.
-
Support Vector Machines (SVM): Finds the best boundary to separate data.
📊 Data Mining vs Traditional Data Analysis:
| Traditional Analysis | Data Mining |
|---|---|
| Often manual, human-driven | Algorithm-based, automated pattern detection. |
| Pre-defined hypothesis testing | Discover unknown relationships. |
| Limited to small/medium datasets | Scales to large datasets (big data). |
| Focus on reporting | Focus on prediction, pattern recognition. |
Why is Data Mining so important today?
- Modern businesses collect petabytes of data.
- Human brains can’t process such huge data intuitively.
- Computers mine this data to extract useful insights in seconds.
It helps in:
- Decision Support
- Market Analysis
- Risk Management
- Customer Retention
Data Mining in Real Life:
| Industry | Use-Case |
|---|---|
| Retail | Recommend products based on user behavior. |
| Banking | Detect credit card fraud patterns. |
| Healthcare | Predict diseases from symptoms and history. |
| E-Commerce | Dynamic pricing and product placement. |
| Social Media | Analyze trends and suggest friends or content. |
Common Misconceptions:
-
Data Mining ≠ Database Querying.
Querying pulls specific, known answers. Data Mining reveals unknown insights. -
Data Mining ≠ Data Warehousing.
Warehousing is about storing and organizing. Mining is about extracting patterns.
Mining Frequent Patterns, Associations, and Correlations
What Are Frequent Patterns?
https://www.geeksforgeeks.org/frequent-pattern-mining-in-data-mining/
A frequent pattern is a set of items, subsequences, or structures that appear together in a dataset with a frequency higher than a given threshold.
Everyday Example:
At a grocery store:
- Customers often buy:
{Milk, Bread, Butter}
together in a single transaction.
If this pattern appears in 40% of all transactions, it’s considered a frequent pattern.
Formal Terms:
-
Itemset: A group of items (like
{Milk, Bread}). -
Support: The fraction or percentage of total transactions that include the itemset.
Formula:
Support(X) = (Number of transactions containing X) / (Total number of transactions)
More Practical Examples:
| Dataset Type | Frequent Pattern Example |
|---|---|
| Online Shopping | {Laptop, Mouse} bought together 2000 times. |
| Healthcare Records | {Cough, Fever, Chest Pain} appearing in diagnosis. |
| Music Streaming | {Hip-Hop, Pop} genres often played together. |
| Social Media Behavior | {Likes, Comments} happening on similar posts. |
Association Rules — More Than Co-Occurrence
Association Rule Mining builds a rule from these frequent patterns:
If X happens, Y likely happens too.For example :
{Milk} → {Bread}
means: If a person buys milk, there’s a high chance they’ll also buy bread.
3 Metrics to Evaluate the Rule
-
Support:
How common is this combination in the dataset?
e.g.,
Support of{Milk → Bread}= 30% if both appear in 30% of all transactions. -
Confidence:
When Milk is bought, how often is Bread also bought?
Formula:
Confidence = Support(Milk & Bread) / Support(Milk) -
Lift:
Measures if Milk and Bread appear together more than random chance.
Formula:
Lift = Confidence / Support(Bread)- Lift > 1: Positive association.
- Lift = 1: Independent.
- Lift < 1: Negative association.
Real-World Association Rule Examples:
| Domain | Rule Example | Use Case |
|---|---|---|
| E-commerce | {Phone} → {Phone Case} | Recommend phone cases after buying a phone. |
| Supermarket | {Chips} → {Soda} | Place chips and soda together in-store. |
| Healthcare | {High BP} → {Heart Disease} | Early diagnosis assistance. |
| Education | {Watching Lectures} → {Higher Exam Scores} | Suggest more video content to struggling students. |
Correlation — Relationship Beyond Co-Occurrence
While association rules show that two things happen together,
Correlation answers:
“Are these things really linked, or is it just a coincidence?”
Example 1: Ice Cream & Sunglasses
- In summer, people often buy both ice cream and sunglasses.
- Association rule might suggest:
{Ice Cream} → {Sunglasses}
But correlation might reveal:
- Both are bought more in summer, but not because of each other.
- The real link is the weather, not the products.
Example 2: Student Grades
-
Students who spend more time in study groups tend to score better.
-
A strong positive correlation between:
{Study Group Hours} ↔ {Exam Scores}Summary Table:
| Concept | Purpose | Example |
|---|---|---|
| Frequent Pattern | Find combinations that occur together often. | {Milk, Bread} appears in 40% of sales. |
| Association Rule | Discover if the occurrence of one item implies another. | {Laptop} → {Mouse} with 80% confidence. |
| Correlation | Determine if the relationship is strong or coincidental. | Ice Cream & Sunglasses — weather-driven. |
So, all in all:
Frequent Patterns reveal what’s popular.
Association Rules predict behaviors.
Correlation explains whether the relation is genuine or accidental.
Sequential Pattern Mining
https://www.geeksforgeeks.org/generalized-sequential-pattern-gsp-mining-in-data-mining/
https://www.youtube.com/watch?v=vWuVbQ_NKcY
Basic of Sequential Pattern (GSP) Mining:
-
Sequence: A sequence is formally defined as the ordered set of items {s1, s2, s3, …, sn}. As the name suggests, it is the sequence of items occurring together. It can be considered as a transaction or purchased items together in a basket.
-
Subsequence: The subset of the sequence is called a subsequence. Suppose {a, b, g, q, y, e, c} is a sequence. The subsequence of this can be {a, b, c} or {y, e}. Observe that the subsequence is not necessarily consecutive items of the sequence. From the sequences of databases, subsequences are found from which the generalized sequence patterns are found at the end.
-
Sequence pattern: A sub-sequence is called a pattern when it is found in multiple sequences. The goal of the GSP algorithm is to mine the sequence patterns from the large database. The database consists of the sequences. When a subsequence has a frequency equal to more than the “support” value. For example: the pattern <a, b> is a sequence pattern mined from sequences {b, x, c, a}, {a, b, q}, and {a, u, b}.
Difference between Transactional and Sequential data
So let’s we have this transactional data of a supermarket
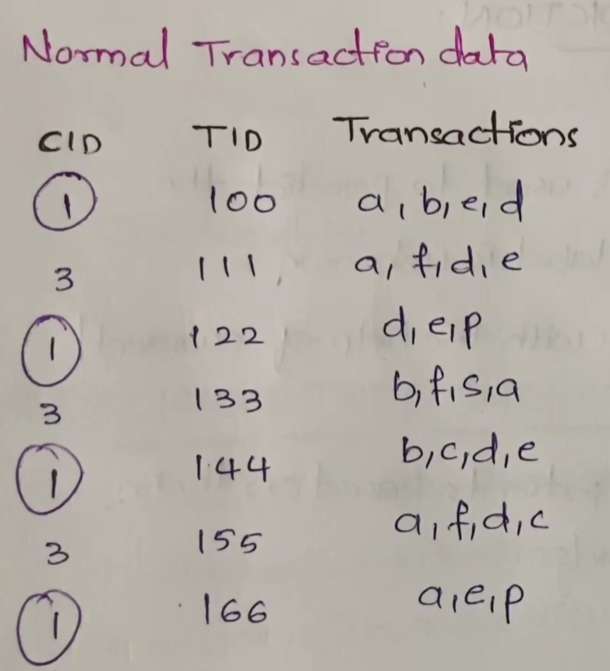
Now storing such transactions in a transaction table would become incredibly complex to store, that’s where sequential patterns come into play
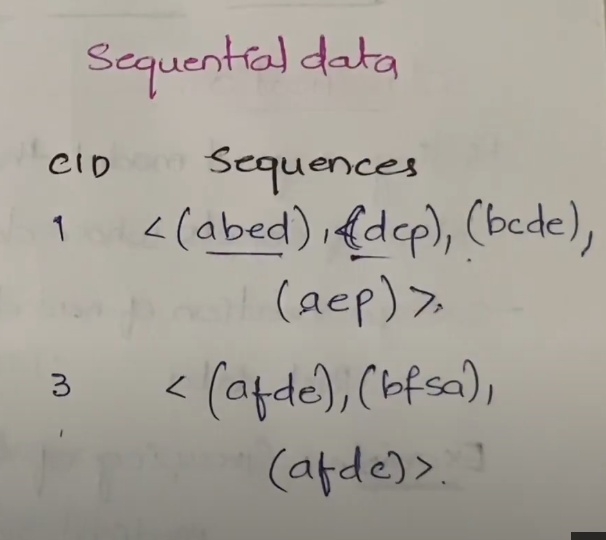
We store all the transactions done by grouping them by CID in a Sequences field which is denoted by the angle brackets <>
Some of the algorithms used in Sequential Pattern Mining
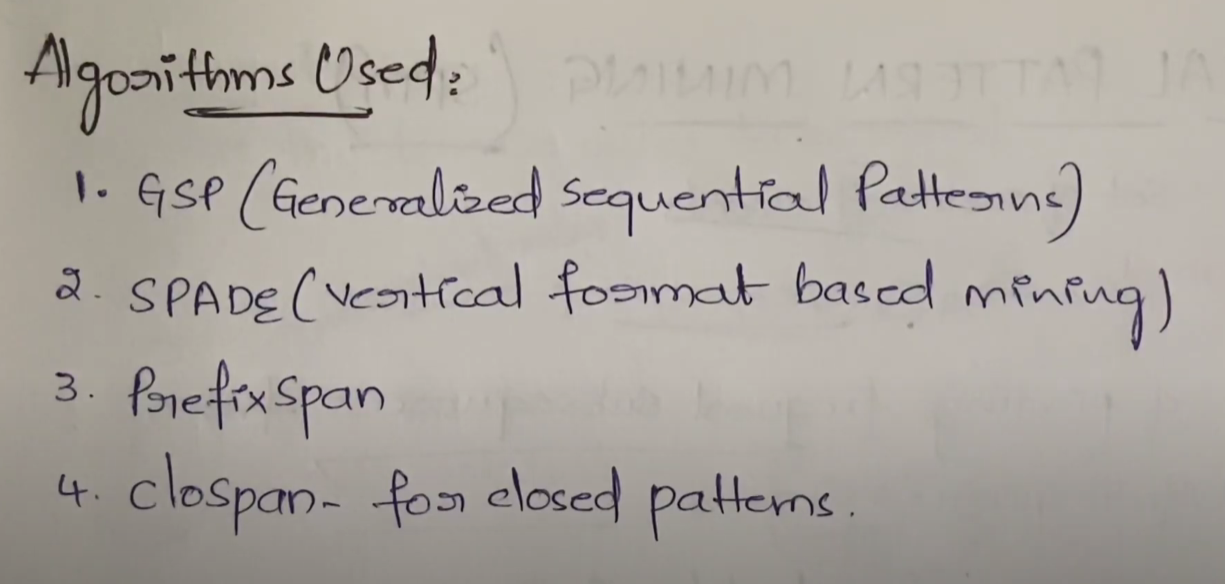
Sequential Pattern (GSP) Mining uses:
Sequential pattern mining, also known as GSP (Generalized Sequential Pattern) mining, is a technique used to identify patterns in sequential data. The goal of GSP mining is to discover patterns in data that occur over time, such as customer buying habits, website navigation patterns, or sensor data.
Some of the main uses of GSP mining include:
Market basket analysis: GSP mining can be used to analyze customer buying habits and identify products that are frequently purchased together. This can help businesses to optimize their product placement and marketing strategies.
- Fraud detection: GSP mining can be used to identify patterns of behavior that are indicative of fraud, such as unusual patterns of transactions or access to sensitive data.
- Website navigation: GSP mining can be used to analyze website navigation patterns, such as the sequence of pages visited by users, and identify areas of the website that are frequently accessed or ignored.
- Sensor data analysis: GSP mining can be used to analyze sensor data, such as data from IoT devices, and identify patterns in the data that are indicative of certain conditions or states.
- Social media analysis: GSP mining can be used to analyze social media data, such as posts and comments, and identify patterns in the data that indicate trends, sentiment, or other insights.
- Medical data analysis: GSP mining can be used to analyze medical data, such as patient records, and identify patterns in the data that are indicative of certain health conditions or trends.
Challenges in Generalized Sequential Pattern Data Mining
The database is passed many times to the algorithm recursively. The computational efforts are more to mine the frequent pattern. When the sequence database is very large and patterns to be mined are long then GSP encounters the problem in doing so effectively.