Index
- 1. Putnam’s Model
- 2. Cyclomatic complexity
- 3. Functional Point Analysis
- Why is FPA considered better than LOC(Lines of Code)?
- 4. CASE Tools
- 5. Spiral Model is not panacea — What do you mean by this?
- 6. Why is the Spiral Model called the Meta Model?
1. Putnam’s Model
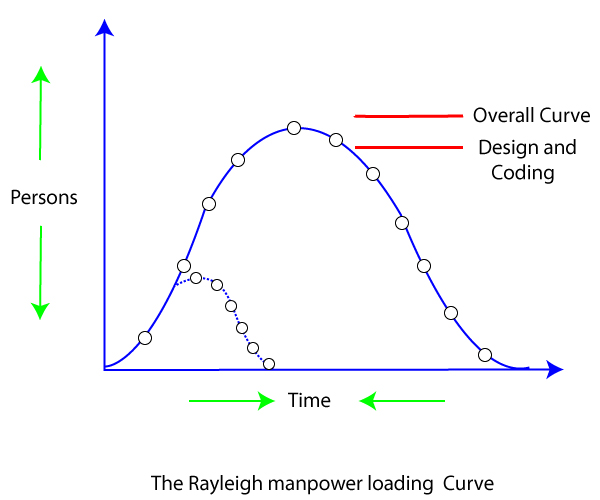
Putnam’s model, also known as the Putnam-Norden-Rayleigh (PNR) Curve or the Software Lifecycle Model, is an empirical model used in software engineering to estimate project effort, cost, and time. It is based on the Rayleigh-Norden curve, which describes the relationship between effort and time during software development.
Key Features of Putnam’s Model
-
Principle:
- The model assumes that software development follows a time-dependent pattern of effort expenditure, similar to a Rayleigh distribution. Effort is distributed in a way that peaks at a certain point in the lifecycle and gradually diminishes.
-
Core Equation: The model uses the following equation, derived from the relationship between development effort, project size, and time:
Where:

- $S$: Software size (in lines of code or function points)
- $E$: Total effort (in person-months)
- $T$: Development time (in months or years)
- $C_k$: Productivity constant, which reflects the capabilities of the team, technology, and tools used
3. Assumptions:
- Productivity varies based on time and resource allocation.
- The relationship between size, effort, and time can be modeled mathematically.
4. Key Metrics:
- **Manpower Buildup**: Effort is not uniform but increases gradually to a peak before tapering off.
- **Time-Effort Trade-off**: Reducing time for a fixed-size project leads to an exponential increase in effort.
- **Productivity Constant**: The $C_k$ value is organization-specific and based on historical data.
5. Applications:
- Estimating development time and cost
- Evaluating resource allocation strategies
- Planning project schedules
6. Strengths:
- Provides a quantitative approach to software project estimation.
- Helps identify how changing one variable (e.g., time) impacts others (e.g., effort).
7. Limitations:
- Relies on accurate size estimation, which can be difficult in early stages.
- Assumes a well-defined, linear lifecycle, which may not fit agile or iterative methodologies.
Practical Use
Putnam’s model is often employed in conjunction with tools like SLIM (Software Life-cycle Management), which implements the PNR curve for real-world project planning and tracking. It is particularly useful for long-term, large-scale software projects with well-documented historical data.
2. Cyclomatic complexity
Cyclomatic Complexity is a software metric used to measure the complexity of a program's control flow. It provides a quantitative assessment of the number of linearly independent paths through a program’s source code. This metric is useful for evaluating the maintainability, readability, and testability of a program.
Key Points of Cyclomatic Complexity
-
Definition: Cyclomatic complexity is calculated based on the program’s control flow graph, where:
- Nodes represent program statements or blocks.
- Edges represent control flow paths between nodes.
-
Formula: The cyclomatic complexity is given by:
Where:
- : Number of edges in the control flow graph
- : Number of nodes in the control flow graph
- : Number of connected components (typically 1 for a single program)
Alternatively, it can be calculated as:
A decision point includes conditional constructs like if, while, for, switch, etc.
-
Interpretation:
- Cyclomatic complexity measures the number of independent paths in the program.
- For a simple linear program (no branches),
- Adding conditional statements increases the complexity.
-
Range of Values:
- 1−10: Low complexity, easy to maintain and test.
- 11−20: Moderate complexity, requires careful testing.
- 21−50: High complexity, testing and maintenance become difficult.
- greater than 50: Very high complexity, indicates poor design and should be refactored.
-
Applications:
- Testing: Ensures that all paths through the program are tested at least once (basis path testing).
- Code Quality: Helps identify overly complex modules that may need refactoring.
- Maintainability: Programs with low cyclomatic complexity are generally easier to understand and modify.
-
Advantages:
- Provides an objective measure of code complexity.
- Helps in identifying risky parts of the codebase.
-
Limitations:
- Does not measure other aspects of complexity, such as code readability or data structure complexity.
- May not correlate well with real-world maintainability in all cases.
Example
For the following pseudo-code:
def example(x, y):
    if x > 0:          # Decision point 1
        if y > 0:      # Decision point 2
            print("x and y are positive")
    else:
print("x is non-positive")- Number of decision points = 2 (
if x > 0andif y > 0) - Cyclomatic Complexity = 2+1=3
This indicates there are 3 independent paths to test.
Write a C program to calculate Cyclomatic complexity of GCD, LCM, Prime Number, Even Number (only study this if you have time)
#include <stdio.h>

// Function to calculate GCD
int gcd(int a, int b) {
    while (b != 0) {
        int temp = b;
        b = a % b;
        a = temp;
    }
    return a;
}

// Function to calculate LCM
int lcm(int a, int b) {
    return (a * b) / gcd(a, b);
}

// Function to check if a number is prime
int is_prime(int n) {
    if (n <= 1) return 0;
    for (int i = 2; i * i <= n; i++) {
        if (n % i == 0) return 0;
    }
    return 1;
}

// Function to check if a number is even
int is_even(int n) {
    return n % 2 == 0;
}

// Function to calculate Cyclomatic Complexity
int calculate_cc(int edges, int nodes, int components) {
    return edges - nodes + 2 * components;
}

int main() {
    // Cyclomatic complexity calculations for each function

    // GCD function
    int gcd_edges = 3;    // while, if, return
    int gcd_nodes = 3;    // start, while, return
    int gcd_components = 1;
    printf("Cyclomatic Complexity of GCD: %d\n", calculate_cc(gcd_edges, gcd_nodes, gcd_components));

    // LCM function
    int lcm_edges = 2;    // function call, return
    int lcm_nodes = 2;    // start, return
    int lcm_components = 1;
    printf("Cyclomatic Complexity of LCM: %d\n", calculate_cc(lcm_edges, lcm_nodes, lcm_components));

    // Prime function
    int prime_edges = 4;  // if, for, if, return
    int prime_nodes = 4;  // start, if, for, return
    int prime_components = 1;
    printf("Cyclomatic Complexity of Prime: %d\n", calculate_cc(prime_edges, prime_nodes, prime_components));

    // Even function
    int even_edges = 2;   // return, modulo
    int even_nodes = 2;   // start, return
    int even_components = 1;
    printf("Cyclomatic Complexity of Even: %d\n", calculate_cc(even_edges, even_nodes, even_components));

    return 0;
}
The above code is based on this formula:
where :
- : Number of edges in the control flow graph
- : Number of nodes in the control flow graph
- : Number of connected components (typically 1 for a single function or main program)
3. Functional Point Analysis
Function Point Analysis (FPA) is a standardized method for measuring the functional size of a software application. It is used to estimate the amount of functionality a system provides to its users and can serve as a basis for project estimation, productivity analysis, and cost measurement.
Key Aspects of Function Point Analysis
-
Purpose:
- To measure software functionality from the user’s perspective.
- To estimate the effort required to develop or maintain a software application.
- To provide a metric that is independent of the programming language or development methodology.
-
Core Components: FPA measures functionality based on five types of components:
- External Inputs (EI): Data received by the system (e.g., forms, input screens).
- External Outputs (EO): Data sent out from the system (e.g., reports, messages).
- External Inquiries (EQ): Interactive inputs and outputs requiring responses (e.g., search queries).
- Internal Logical Files (ILF): Logical data maintained by the system (e.g., database tables).
- External Interface Files (EIF): Data accessed but not maintained by the system (e.g., external files or databases).
-
Steps in Function Point Analysis: FPA involves the following steps:
Step 1: Identify the Scope
- Define the boundary of the application being analyzed.
Step 2: Count the Functional Components
- Determine the number of EIs, EOs, EQs, ILFs, and EIFs in the system.
Step 3: Assign Complexity Weights
- Each functional component is assigned a complexity level (low, medium, high) based on its characteristics.
- Assign corresponding weights based on a predefined table (e.g., IFPUG standards).
Step 4: Compute Unadjusted Function Points (UFP)
- Sum the weighted counts of all components:
Step 5: Apply Value Adjustment Factor (VAF)
-
Evaluate 14 General System Characteristics (e.g., performance, reusability, security) to compute the VAF.
-
Calculate the Adjusted Function Points (AFP):
-
General System Characteristics (GSCs): Examples include:
- Data communications
- Distributed processing
- Performance requirements
- Heavily used configuration
- Ease of installation
- Ease of operation
- Maintainability
-
Applications:
- Effort Estimation: Predicting the effort required to develop or maintain software.
- Benchmarking: Comparing productivity across projects or teams.
- Cost Estimation: Calculating project costs based on AFP.
- Performance Metrics: Evaluating developer efficiency.
-
Advantages:
- Provides a user-oriented view of the system.
- Language-independent, making it applicable across different platforms.
- Helps in managing and controlling software projects effectively.
-
Limitations:
- Requires thorough knowledge of the system’s functionality.
- Subjective assessment in determining complexity and system characteristics.
- Time-consuming for very large projects.
Example Calculation
Consider an application with:
- 10 External Inputs (5 low complexity, 5 medium complexity)
- 5 External Outputs (all medium complexity)
- 3 Internal Logical Files (2 medium complexity, 1 high complexity)
- 2 External Interface Files (both low complexity)
Using predefined weights:
- EI (low: 3, medium: 4)
- EO (medium: 5)
- ILF (medium: 10, high: 15)
- EIF (low: 5)
Unadjusted Function Points:
If VAF = 10, the Adjusted Function Points:
Why is FPA considered better than LOC(Lines of Code)?
Function Point Analysis (FPA) ==is considered better than Lines of Code (LOC) for many aspects of software estimation because it focuses on measuring the functionality provided to the user rather than the amount of code written==. Here are the key reasons why FPA is preferred over LOC in certain scenarios:
1. Language Independence
- FPA: Measures functionality from the user’s perspective, independent of the programming language or tools used.
- LOC: Highly dependent on the programming language. The same functionality might require significantly different amounts of code in different languages (e.g., Java vs. Python).
Why FPA is better: It allows fair comparison across projects developed using different languages or technologies.
2. Focus on Functionality
- FPA: Captures the complexity and scope of what the software does for the user, such as inputs, outputs, and data storage.
- LOC: Measures the physical size of the codebase, which doesn’t always correlate with the system’s functional value.
Why FPA is better: It aligns with the user’s perspective, making it more meaningful for stakeholders.
3. Better for Early-Stage Estimation
- FPA: Can be applied early in the software development lifecycle when requirements are defined, even before coding begins.
- LOC: Requires a detailed design or implementation to estimate the number of lines of code, making it unsuitable for early-stage planning.
Why FPA is better: It helps project managers estimate costs and timelines during initial planning phases.
4. Suitability for Modern Software Development
- FPA: Works well with modern methodologies like Agile, where frequent updates and modular development are common.
- LOC: Becomes less relevant in environments where small, reusable modules or low-code/no-code platforms are used.
Why FPA is better: It adapts to evolving software development practices, while LOC struggles to reflect modern paradigms.
5. Encourages Efficient Design
- FPA: Rewards efficient design by focusing on delivering functionality with minimal complexity.
- LOC: May incentivize developers to write more code unnecessarily to meet metrics or deadlines.
Why FPA is better: It aligns productivity with the user’s functional needs, not the volume of code written.
6. More Meaningful Productivity Metrics
- FPA: Measures productivity in terms of delivered functionality per unit of effort (e.g., function points per person-month).
- LOC: Measures productivity based on the amount of code written, which doesn’t always reflect developer efficiency or software quality.
Why FPA is better: It provides a clearer picture of team productivity and system value.
7. Maintenance and Enhancement
- FPA: Accounts for functionality changes during maintenance, making it easier to estimate effort for updates and enhancements.
- LOC: Can’t effectively capture the effort required for changes, as modifications to functionality don’t always translate into significant changes in LOC.
Why FPA is better: It handles the dynamic nature of software better, especially during long-term maintenance.
8. Avoids Misleading Comparisons
- FPA: Normalizes measurement across projects by focusing on functional value.
- LOC: Can lead to misleading comparisons, such as rewarding verbose coding styles or penalizing concise languages.
Why FPA is better: It provides a consistent and fair way to compare different projects or teams.
FPA in Relation to the COCOMO Model
While the COCOMO model uses LOC as its primary size metric, FPA can be integrated into COCOMO by converting function points to equivalent LOC using a language-specific conversion factor. This hybrid approach allows teams to leverage FPA’s strengths while utilizing COCOMO’s robust estimation framework.
Conclusion
FPA’s focus on functionality, language independence, and adaptability to modern development practices make it a more user-centric and meaningful metric compared to LOC. For this reason, it is often preferred for project estimation, especially in scenarios where early-stage planning, cross-language comparisons, or a focus on functional value are essential.
4. CASE Tools
CASE (Computer-Aided Software Engineering) tools are software applications designed to assist in the various stages of the software development lifecycle (SDLC). These tools aim to enhance productivity, improve quality, and reduce errors in software development by automating tasks, ensuring consistency, and facilitating collaboration.
Types of CASE Tools
CASE tools can be broadly categorized based on the stages of the SDLC they support:
-
Upper CASE Tools (Planning and Analysis)
- Focus on the early stages of development, such as project planning, requirements gathering, and system analysis.
- Examples:
- Requirement management tools (e.g., IBM DOORS, Jama Connect)
- UML diagramming tools (e.g., Lucidchart, Visual Paradigm)
-
Lower CASE Tools (Implementation and Maintenance)
- Focus on later stages like coding, testing, and maintenance.
- Examples:
- IDEs (e.g., IntelliJ IDEA, Eclipse, Visual Studio)
- Debugging and testing tools (e.g., Selenium, JUnit)
-
Integrated CASE Tools (All Stages)
- Support the entire SDLC, providing a unified environment for development and management.
- Examples:
- Enterprise-level tools (e.g., IBM Rational Suite, Oracle JDeveloper)
Functions and Features of CASE Tools
CASE tools offer a variety of features to support software development:
-
Requirement Analysis and Modeling
- Helps capture and document requirements.
- Supports visual modeling using tools like flowcharts, ER diagrams, and UML diagrams.
-
System Design
- Facilitates the creation of system architectures and detailed design models.
- Generates design documentation automatically.
-
Code Generation
- Automates code generation based on the design models, reducing manual coding effort.
-
Testing and Debugging
- Provides tools for test case creation, automated testing, and debugging.
- Supports unit, integration, and system testing.
-
Project Management
- Helps in resource allocation, task scheduling, and tracking project progress.
- Offers Gantt charts, PERT charts, and other management aids.
-
Version Control and Configuration Management
- Manages changes in code and documentation.
- Provides tools for tracking versions and maintaining consistency.
-
Documentation
- Automatically generates technical and user documentation.
- Ensures that documentation stays in sync with the system.
Advantages of CASE Tools
- Improved Productivity: Automates repetitive tasks, reducing development time.
- Better Quality: Enforces standards and consistency, minimizing errors.
- Enhanced Collaboration: Facilitates communication among team members through shared models and documentation.
- Traceability: Ensures that all stages of development are linked, enabling better tracking of changes.
- Reduced Cost: Early error detection and automation lead to cost savings over the project lifecycle.
Disadvantages of CASE Tools
- High Initial Cost: Purchasing and implementing CASE tools can be expensive.
- Learning Curve: Requires training and expertise to use effectively.
- Overhead: May introduce additional complexity, especially in smaller projects.
- Customization Limitations: Standardized approaches may not fit all projects.
Examples of CASE Tools
Here are some commonly used CASE tools:
- Requirement Analysis and Design: Enterprise Architect, Rational Rose, StarUML
- Code Development and Testing: Visual Studio, IntelliJ IDEA, Selenium
- Project Management: Microsoft Project, JIRA, Trello
- Configuration Management: Git, Subversion, Jenkins
Applications of CASE Tools
- Large-scale software development projects.
- Complex systems requiring high reliability (e.g., aerospace, healthcare, banking).
- Agile and DevOps environments for rapid development and continuous delivery.
Conclusion
CASE tools streamline the software development process by automating tasks, improving consistency, and facilitating collaboration. They are especially valuable for large or complex projects where maintaining standards and minimizing errors are critical. However, their implementation requires careful consideration of costs, team expertise, and project needs.
5. Spiral Model is not panacea — What do you mean by this?
The statement “Spiral model is not a panacea” means that while the Spiral Model is a highly effective and flexible software development model, it is not a universal solution for all software engineering problems. Each project has its unique requirements, constraints, and contexts, and the Spiral Model may not be the best fit for every situation. Here are the key reasons why:
1. High Cost and Complexity
- The Spiral Model involves repeated iterations of planning, risk analysis, prototyping, and evaluation, which can be expensive and time-consuming.
- Small projects with limited budgets may not justify the use of the Spiral Model, as the overhead can outweigh the benefits.
2. Requires Risk Expertise
- A core aspect of the Spiral Model is risk assessment and mitigation at each iteration.
- Projects that lack experienced risk analysts or tools for proper risk management may struggle to implement the Spiral Model effectively.
3. Not Suitable for All Projects
- The Spiral Model is best suited for large, complex, and high-risk projects, such as those in aerospace or defense industries.
- For small, well-defined projects with clear requirements, simpler models like the Waterfall or Agile may be more efficient and cost-effective.
4. Dependence on Customer Involvement
- The Spiral Model relies heavily on frequent customer interaction and feedback at each iteration.
- In cases where customer involvement is limited or unavailable, the model’s effectiveness diminishes.
5. Potential for Scope Creep
- Due to its iterative nature, the Spiral Model may lead to continuous changes and additions to requirements.
- Without proper control, this can result in scope creep, where the project grows beyond its original goals, leading to delays and cost overruns.
6. Complex Management
- Managing a project with the Spiral Model can be challenging, as it requires careful coordination across multiple iterations and disciplines.
- Teams that lack strong project management skills may find it difficult to implement effectively.
7. Long Development Time
- The iterative and risk-focused nature of the Spiral Model can make development cycles longer compared to other models, which may not be ideal for projects with tight deadlines.
Conclusion
The Spiral Model is a powerful approach for managing uncertainty and complexity in software development, but it is not a one-size-fits-all solution. Teams must carefully evaluate their project requirements, resources, and constraints before choosing the Spiral Model. Simpler models or hybrid approaches may be more appropriate in cases where the Spiral Model’s advantages are not fully leveraged.
6. Why is the Spiral Model called the Meta Model?
The Spiral Model is called a Meta-Model because it serves as a framework or overarching model that integrates the features and strengths of several other traditional software development models, such as the Waterfall Model, Prototyping Model, and Incremental Model. This makes the Spiral Model a higher-level model that can adapt to and guide the use of various methodologies based on project needs.
Here’s why it is considered a Meta-Model:
1. Combines Multiple Models
- The Spiral Model combines aspects of:
- Waterfall Model: Linear planning and sequential development within individual spirals.
- Prototyping Model: Focus on iterative refinement through prototyping and user feedback.
- Incremental Model: Gradual build-up of the system across multiple iterations.
- This integration allows the Spiral Model to adapt to diverse project requirements.
2. Framework for Tailoring
- The Spiral Model provides a flexible structure that can be tailored to the specific needs of a project.
- Depending on the project’s complexity, risk, and requirements, developers can use different models within each spiral cycle.
3. Iterative and Incremental Nature
- Each spiral cycle involves repeated refinement of the product through iterative processes.
- The Meta-Model nature lies in its ability to dynamically switch between various development techniques within iterations.
4. Emphasis on Risk Management
- Risk management is at the core of the Spiral Model, which distinguishes it from other traditional models.
- This makes it a guiding framework that ensures projects remain adaptable and focused on addressing uncertainties and risks.
5. Evolutionary Nature
- The Spiral Model facilitates continuous improvement and evolution of the development process itself.
- It acts as a Meta-Model by adapting methodologies to accommodate changing project conditions, user feedback, or unforeseen challenges.
6. Scalability
- The Spiral Model can scale up or down, making it applicable for projects of varying sizes and complexities.
- This scalability allows it to serve as a guiding framework for multiple approaches and tools.
Conclusion
The Spiral Model is called a Meta-Model because it is not just a single methodology but rather a flexible, adaptive framework that incorporates and integrates the principles and practices of other models. This flexibility allows it to act as a higher-order blueprint for designing and managing the software development process in a way that aligns with the unique demands of a given project.